. 2016 Jun;171(2):1113-27.
doi: 10.1104/pp.16.00124. Epub 2016 Apr 14.

A Homolog of Blade-On-Petiole 1 and 2 (BOP1/2) Controls Internode Length and Homeotic Changes of the Barley Inflorescence

Affiliations

A Homolog of Blade-On-Petiole 1 and 2 (BOP1/2) Controls Internode Length and Homeotic Changes of the Barley Inflorescence

Matthias Jost et al. Plant Physiol. 2016 Jun.

Abstract

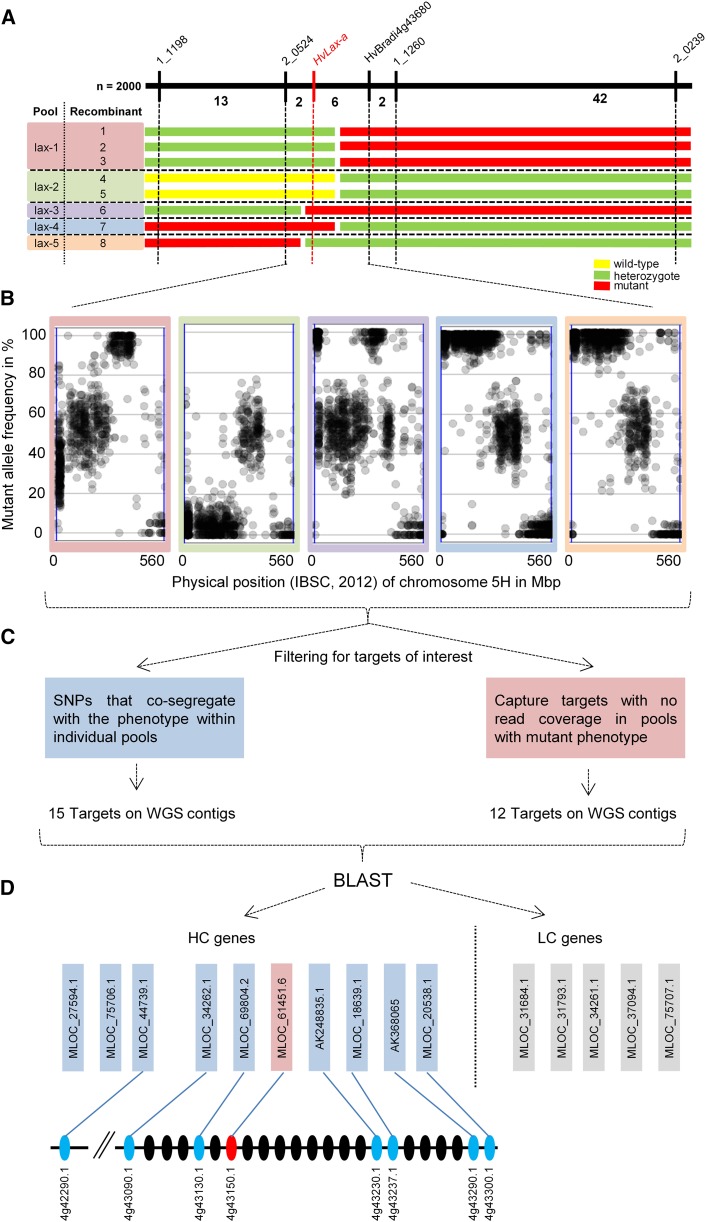
Inflorescence architecture in small-grain cereals has a direct effect on yield and is an important selection target in breeding for yield improvement. We analyzed the recessive mutation laxatum-a (lax-a) in barley (Hordeum vulgare), which causes pleiotropic changes in spike development, resulting in (1) extended rachis internodes conferring a more relaxed inflorescence, (2) broadened base of the lemma awns, (3) thinner grains that are largely exposed due to reduced marginal growth of the palea and lemma, and (4) and homeotic conversion of lodicules into two stamenoid structures. Map-based cloning enforced by mapping-by-sequencing of the mutant lax-a locus enabled the identification of a homolog of BLADE-ON-PETIOLE1 (BOP1) and BOP2 as the causal gene. Interestingly, the recently identified barley uniculme4 gene also is a BOP1/2 homolog and has been shown to regulate tillering and leaf sheath development. While the Arabidopsis (Arabidopsis thaliana) BOP1 and BOP2 genes act redundantly, the barley genes contribute independent effects in specifying the developmental growth of vegetative and reproductive organs, respectively. Analysis of natural genetic diversity revealed strikingly different haplotype diversity for the two paralogous barley genes, likely affected by the respective genomic environments, since no indication for an active selection process was detected.


Figures

Figure 1.
Figure 1.
The lax-a phenotype of BW457. A, The lax-a phenotype is characterized by an increased spike length caused by 15% longer rachis internodes compared with the wild type (Supplemental Fig. S1). B and C, Lodicules of wild-type plants (B) are homeotically converted into additional stamenoid organs in lax-a mutants (C). D, Cross sections through young wild-type (top) and lax-a (bottom) florets showing that the additional stamens are smaller and comprise only two instead of four locules. E to H, Compared with wild-type lemma and palea (E), the lax-a palea and lemma are much more narrow (F), which leads to exposed and visible caryopses in mature lax-a inflorescences (right sample; G) and causes opening of flowers in lax-a mutants (right) while wild-type flowers stay closed (H). I, Awns of lax-a plants (right) have a very wide base compared with the wild type (left).
Figure 2.
Figure 2.
Cloning-by-sequencing of the gene HvLax-a. A sequence-assisted evaluation of a predefined mapping interval was used to identify candidate genes underlying the lax-a phenotype. A, Eight recombinant plants out of 1,970 F2 plants delimited a 0.2-cM mapping interval on chromosome 5H. Marker scores and phenotype scores for each recombinant are represented by a color code for simplification (yellow = wild type, green = heterozygote, and red = mutant). Genotypes with identical marker haplotype/phenotype combinations were pooled for target enrichment resequencing (Mascher et al., 2013a). B, Obtained sequence reads of the individual pools were mapped to the reference cv Bowman (Mayer et al., 2012) for SNP discovery and determination of SNP frequencies. Visualization of SNP frequency plots was restricted to chromosome 5H for each individual pool. The x axis shows the physical expansion of chromosome 5H (Mayer et al., 2012), and the y axis represents the percentage of mapped reads with alternative mutant alleles from 0% to 100% for each SNP (visualized as dots). C, Filtering for candidates identified 27 targets on WGS sequence contigs. D, Identified high-confidence (HC) and low-confidence (LC) genes (Mayer et al., 2012) on WGS contigs were used for homology analysis and revealed that seven of eight identified putative homolog Brachypodium spp. gene models cluster in a small syntenic interval of Brachypodium spp.
Figure 3.
Figure 3.
Schematic map of induced mutations in the gene HvLax-a. The genomic sequence of HvLax-a, consisting of two exons (black boxes) spaced by a single intron (black line), is visualized. Green boxes indicate conserved sequences encoding for the protein domains of BROAD COMPLEX, TRAMTRACK, and BRIC À BRAC (BTB) and ANKYRIN REPEAT (ANK). The distribution of mutant alleles is visualized along the HvLax-a gene model for lax mutant accessions obtained from the Nordic Genetic Resource Center (http://www.nordgen.org/; A) and targeting induced local lesions in genomes (TILLING) analysis (B). Triangles are color coded according to the effect of the mutation (black = nonsynonymous, gray = synonymous, red = premature stop, blue = altered splicing, and white = deletion). The red line indicates the partial deletion present in cv Bowman NIL BW458 (B).
Figure 4.
Figure 4.
Diversity analysis of HvLax-a and HvCul4. Median-joining networks were derived from haplotypes identified by resequencing the ORF of HvLax-a (A) and HvCul4 (B) in 83 H. spontaneum accessions (yellow), 55 barley landraces (red), 150 barley cultivars (green), and 17 accessions of breeding/research material (purple). Haplotypes were labeled with haplotype identifiers and numbers of accessions sharing the respective haplotype (parentheses). Circle sizes are proportional to the number of accessions per haplotype. Lengths of connector lines refer to the number of nucleotide substitutions between haplotypes (numbers on connecting lines = the number of mutations).

References

    1. Altschul SF, Gish W, Miller W, Myers EW, Lipman DJ (1990) Basic local alignment search tool. J Mol Biol 215: 403–410 - PubMed
    1. Andrés F, Romera-Branchat M, Martínez-Gallegos R, Patel V, Schneeberger K, Jang S, Altmüller J, Nürnberg P, Coupland G (2015) Floral induction in Arabidopsis by FLOWERING LOCUS T requires direct repression of BLADE-ON-PETIOLE genes by the homeodomain protein PENNYWISE. Plant Physiol 169: 2187–2199 - PMC - PubMed
    1. Ariyadasa R, Mascher M, Nussbaumer T, Schulte D, Frenkel Z, Poursarebani N, Zhou R, Steuernagel B, Gundlach H, Taudien S, et al. (2014) A sequence-ready physical map of barley anchored genetically by two million single-nucleotide polymorphisms. Plant Physiol 164: 412–423 - PMC - PubMed
    1. Bandelt HJ, Forster P, Röhl A (1999) Median-joining networks for inferring intraspecific phylogenies. Mol Biol Evol 16: 37–48 - PubMed
    1. Begun DJ, Aquadro CF (1992) Levels of naturally occurring DNA polymorphism correlate with recombination rates in D. melanogaster. Nature 356: 519–520 - PubMed

Publication types

MeSH terms

Substances

LinkOut - more resources