Review
. 2016 Jun;171(2):727-58.
doi: 10.1104/pp.16.00470. Epub 2016 Apr 25.

Techniques for the Analysis of Protein-Protein Interactions in Vivo

Affiliations
Review

Techniques for the Analysis of Protein-Protein Interactions in Vivo

Shuping Xing et al. Plant Physiol. 2016 Jun.

Abstract

Identifying key players and their interactions is fundamental for understanding biochemical mechanisms at the molecular level. The ever-increasing number of alternative ways to detect protein-protein interactions (PPIs) speaks volumes about the creativity of scientists in hunting for the optimal technique. PPIs derived from single experiments or high-throughput screens enable the decoding of binary interactions, the building of large-scale interaction maps of single organisms, and the establishment of cross-species networks. This review provides a historical view of the development of PPI technology over the past three decades, particularly focusing on in vivo PPI techniques that are inexpensive to perform and/or easy to implement in a state-of-the-art molecular biology laboratory. Special emphasis is given to their feasibility and application for plant biology as well as recent improvements or additions to these established techniques. The biology behind each method and its advantages and disadvantages are discussed in detail, as are the design, execution, and evaluation of PPI analysis. We also aim to raise awareness about the technological considerations and the inherent flaws of these methods, which may have an impact on the biological interpretation of PPIs. Ultimately, we hope this review serves as a useful reference when choosing the most suitable PPI technique.


Figures

Figure 1.
Figure 1.
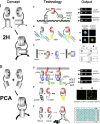
Protein-protein interaction techniques. I, Two-hybrid techniques (2H) use two functional proteins or domains as probes. Their inherent functionality is symbolized by dashed arrows, which can represent either DNA-binding or transcriptional activity for the GAL4 DNA-binding and transactivation domains in yeast two-hybrid analysis (A) or fluorescence upon excitation such as in Förster resonance energy transfer (FRET) sensors (B). The proximity of the probes suffices for reporter output to be detected, as indicated by the black arrow. A, Example of the yeast two-hybrid technique and its reporter output (i.e. growth on depleted [interaction-selective] medium). AD, Activation domain; BD, DNA-binding domain; UAS, upstream activating sequence. B, Cartoon of a typical FRET interaction and its visualization through sensitized emission (see “FRET: Lifetime Versus Intensity” for details). C, Strictly speaking, coimmunoprecipitation (CoIP) can be counted as a two-hybrid technique when both bait and prey are fused to epitope tags (e.g. GFP). An interaction is reported through immunoblotting of the extract prior to column loading (L) and, after washing, the eluate (IP). M, Marker. II, Protein fragment complementation assays (PCAs), such as the split-ubiquitin system (D), bimolecular fluorescence complementation (BiFC; E), and split-luciferase complementation (F), use two non-functional protein fragments as probes. Only upon reassembly is their intrinsic function (enzymatic, fluorescence, and so on) restored, which is used to reveal an interaction (black arrow). D, Diagram of a split-ubiquitin assay; interactions are monitored through growth on depleted medium, which is similar to yeast two-hybrid analysis. E, Cartoon of BiFC analysis and its (suboptimal) detection through confocal microscopy. See “BiFC: From Cherry Picking to Quantification” for further details on the appropriate analysis, quantification, and controls for this particular PPI technique. F, Split-luciferase complementation assay and its application on a 96-well plate, which enables high-throughput analysis of plant protoplasts by directly measuring luminescence after the addition of substrate (luciferin). + and − refer to typical positive and negative interactions, respectively, throughout.
Figure 2.
Figure 2.
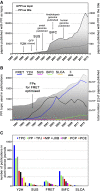
Publication statistics on PPI methods (as of February 2016). A, Total number of publications that feature the search string “protein-protein interaction(s)” either as the topic keyword (gray surface plot, axis on left) or in the title (dotted line, axis on right), as analyzed using the Thomson Reuters Web of Science database. Vertical arrows mark important technological or scientific discoveries and their publication date by year. B, Number of scientific publications per year in which any of the five PPI techniques were mentioned as a topic keyword (Thomson Reuters Web of Science). The arrow highlights the year in which the first GFP-derived FRET probes were reported (Heim and Tsien, 1996). The gray-shaded area corresponds to the total number of all publications per year (Σ). C, Number of scientific publications featuring any of the corresponding PPI techniques in the top eight plant science journals (TPC = The Plant Cell, PP = Plant Physiology, TPJ = The Plant Journal, MP = Molecular Plant, JXB = Journal of Experimental Botany, NP = New Phytologist, PCP = Plant and Cell Physiology, and PCE = Plant, Cell & Environment). The following keyword search strings for the abbreviated methods in B and C were used: Y2H = yeast two-hybrid; SUS = split-ubiquitin; FRET = Förster resonance energy transfer or fluorescence resonance energy transfer; BiFC = bimolecular fluorescence complementation; and SLCA = split-luciferase.
Box II
Box II
Figure: Kinetics and affinities of PPI techniques. The Kd is inversely correlated to the binding affinity. PPIs can exist as permanent or transient interactions. While transient interactions can be described as weak due to the higher probability of complex dissociation, strong transient or permanent interactions bear higher intrinsic binding affinity and greater temporal stability. More details are given in the text and references (Banaszynski et al., 2005; Perkins et al., 2010; Kastritis et al., 2011).
Figure 3.
Figure 3.
The yeast two-hybrid system and its modifications. A, The original yeast two-hybrid analysis detects an interaction between two proteins fused to either the DNA-binding domain (BD; bait) or the DNA transactivation domain (AD; prey) of GAL4, respectively. An interaction reconstitutes the DNA-binding and transactivation domains to activate reporter genes such as ADE2, HIS3, and lacZ. B, A cDNA library screen allows the identification of novel binding partners (green crayon-like shape), whereas non-interacting proteins (opaque square and sphere) fail to activate the reporter genes. C, Examples of false-positive results that might be detected in yeast two-hybrid cDNA library screens that should be excluded by appropriate testing (see “The Yeast Two-Hybrid Technique: Where It All Began” and Box I): (1) unrelated prey fusions that bind to the bait; (2) transcriptional activators that are sufficient to trigger reporter gene activity; and (3) enzymes that overcome the selection pressure on depleted medium by restoring prototrophy. D, An extension of the classic yeast two-hybrid system is yeast three-hybrid analysis, in which two noninteracting or weakly interacting proteins (bait I and bait II) are bridged or stabilized by a third protein (cyan; prey/bridge). E, Reverse yeast two-hybrid detects the interference of a known interaction couple and can be used to screen for inhibiting proteins or molecules (red cones). Transcript activation of a selection marker such as URA3 renders yeast sensitive to 5-fluoroorotic acid. If the interaction is prevented, the reporter genes are not activated and the yeast can survive on 5-fluoroorotic acid. UAS, Upstream activating sequence.
Figure 4.
Figure 4.
The split-ubiquitin system and its modifications. A and B, N-terminal (NubG) and C-terminal (Cub) ubiquitin moieties (blue half-spheres) are fused to two POIs, prey and bait, whereby the bait protein (red) needs to be membrane anchored either through an intrinsic transmembrane domain (red helix; A) or an artificial N-terminally attached OST4 (Oligosaccharyltransferase 4) transmembrane domain (blue helix; B). In both split-ubiquitin versions, the reassembly of Cub and NubG through the interaction of bait and prey leads to the release of a chimeric transcription factor, LexA-VP16, which activates the reporter genes ADE2, HIS3, and lacZ. C, The split-ubiquitin system also can be expanded to a split-ubiquitin bridge assay. D, An alternative split-ubiquitin approach that does not require the use of membrane-anchored baits uses the N-end rule of degradation. The auxotrophy marker URA3 (which can be counterselected using 5-fluoroorotic acid) is preceded by a destabilizing Arg residue. Cleavage of URA3 upon the reassembly of Cub and Nub leads to its rapid degradation. E, A recent improvement of the split-ubiquitin system called SPLIFF enables the time-resolved analysis of interactions. The bait protein is tagged with an mCherry-Cub-GFP protein. Upon interaction, Cub and Nub reassemble, leading to the cleavage and degradation of GFP. The ratio between mCherry and GFP can be measured over time, providing information about the kinetics of an interaction.
Figure 5.
Figure 5.
FRET. A, Simplified Jablonski diagram. A fluorescent protein (here depicted as the cyan-colored crystal structure of a CFP attached to a POI in gray) that absorbs light (blue wavy arrow) causes an electron to be raised to an excited singlet state, S1* (blue solid arrow). Internal conversion (black wavy arrow) causes relaxation to the S1 ground state (cyan solid arrow). Crossing of the energy barrier between S1 and S0 can cause the emission of a photon at a longer wavelength (red shifted, Stokes shift; i.e. fluorescence). If an acceptor molecule is in close enough proximity (here, YFP attached to a red-colored interacting protein), the energy can be transferred non-radiatively to the acceptor molecule. Relaxation of the acceptor molecule, in turn, can lead to even more red-shifted fluorescence. B, Absorbance/fluorescence spectrum of mTurquoise2 and mVenus. The dark gray surface depicts the λ4 weighted overlap integral. Acceptor and donor spectral bleed through are shown in magenta and green, respectively (see “FRET: Lifetime Versus Intensity” for details; image modified from Hecker et al., 2015). C, Example of a FRET acceptor photobleaching experiment. A nucleus expressing two interacting proteins attached to a donor and an acceptor fluorophore. After bleaching (right), the acceptor fluorescence is almost completely lost, but an increase in donor fluorescence can be detected (image from Hecker et al., 2015, modified for visualization purposes only). D, Exemplary fluorescence lifetime decay curve of a putative donor molecule when FRET is occurring (red solid curve; τ1) or in the absence of FRET (cyan solid line; τ2). Fluorescence lifetime τ is the average time that a fluorescent protein resides in the excited state and at which fluorescence intensity decreased to 1/e of its initial value.
Figure 6.
Figure 6.
Ratiometric BiFC (rBiFC). A, Cotransformation ratios of transiently transformed N. benthamiana. Mixing of A. tumefaciens with two individual plasmids each resulted in approximately 77.6% cotransformed cells (n = 1,221 cells), whereas transformation with one plasmid containing both expression constructs yielded 99.3% cotransformation (n = 1,099 cells). Cotransformation is characterized by a ratio of mCherry to mEGFP intensity of between 0.2 and 5, with ratios below and above considered to indicate non-cotransformed cells. Sample confocal images, from left to right, are as follows: mCherry fluorescence, mEGFP fluorescence, and merged channels (image modified from Hecker et al., 2015). B, Sample ratiometric BiFC experiment with a T-DNA cartoon at the top (data from Hecker et al., 2015). Cytosolic nYFP-SNAP33 and either plasma membrane-localized cYFP-SYP121 or pre-vacuolar compartment/tonoplast membrane-localized cYFP-SYP21 were coexpressed from a single contiguous T-DNA including a reference RFP marker (Grefen and Blatt, 2012a). The ratio of complemented YFP to RFP was calculated from 20 complete individual images, each recorded at the interfaces of two to three cells to avoid bias arising from choosing single cells. As the interaction is at the cell periphery, imaging of the nucleus was prevented to avoid a disproportionate increase in the detection of soluble RFP, which migrates into the nucleus and would bias this assay. Data from 20 independent YFP-RFP ratios are shown as box-plot diagrams (the light gray box represents the 25% to 50% range and the dark gray box represents the 50% to 75% range of where all values lay). Whiskers mark the 1.5× interquartile range, and black dots indicate outliers. C, Potential interactions in a BiFC experiment when a competitor is coexpressed. From left to right, dynamic binding of a potential transient interaction causes alternation in binding of the prey protein (gray) to either the tagged or untagged bait (red). However, if the fluorescent protein fragments are allowed to interact long enough, the irreversibility of their complementation depletes them from the equation. The signal accumulates and reports an interaction despite the presence of a competitor.

References

    1. Aakre CD, Herrou J, Phung TN, Perchuk BS, Crosson S, Laub MT (2015) Evolving new protein-protein interaction specificity through promiscuous intermediates. Cell 163: 594–606 - PMC - PubMed
    1. Adjobo-Hermans MJ, Goedhart J, Gadella TW Jr (2006) Plant G protein heterotrimers require dual lipidation motifs of Galpha and Ggamma and do not dissociate upon activation. J Cell Sci 119: 5087–5097 - PubMed
    1. Akrap N, Seidel T, Barisas BG (2010) Förster distances for fluorescence resonant energy transfer between mCherry and other visible fluorescent proteins. Anal Biochem 402: 105–106 - PMC - PubMed
    1. Albert I, Bohm H, Albert M, Feiler CE, Imkampe J, Wallmeroth N, Brancato C, Raaymakers TM, Oome S, Zhang HQ, et al. (2015) An RLP23-SOBIR1-BAK1 complex mediates NLP-triggered immunity. Nat Plants 1: 15140. - PubMed
    1. Ando R, Hama H, Yamamoto-Hino M, Mizuno H, Miyawaki A (2002) An optical marker based on the UV-induced green-to-red photoconversion of a fluorescent protein. Proc Natl Acad Sci USA 99: 12651–12656 - PMC - PubMed

Publication types