. 2016 Oct:65:425-435.
doi: 10.1016/j.reprotox.2016.05.008. Epub 2016 May 18.

Developmental cigarette smoke exposure II: Kidney proteome profile alterations in 6 month old adult offspring

Affiliations

Developmental cigarette smoke exposure II: Kidney proteome profile alterations in 6 month old adult offspring

Rachel E Neal et al. Reprod Toxicol. 2016 Oct.

Abstract

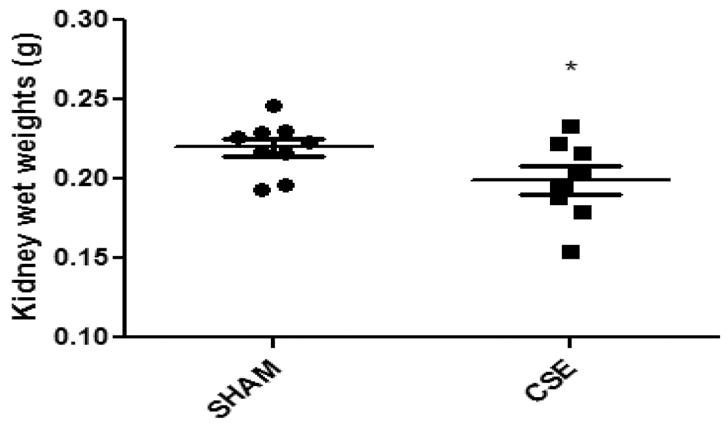
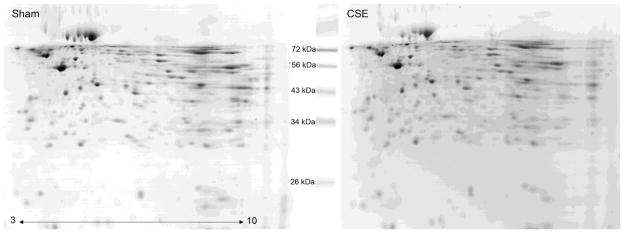
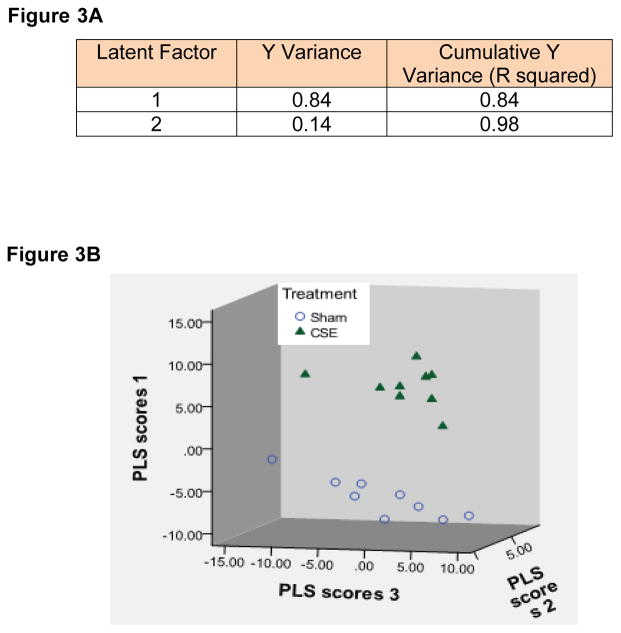
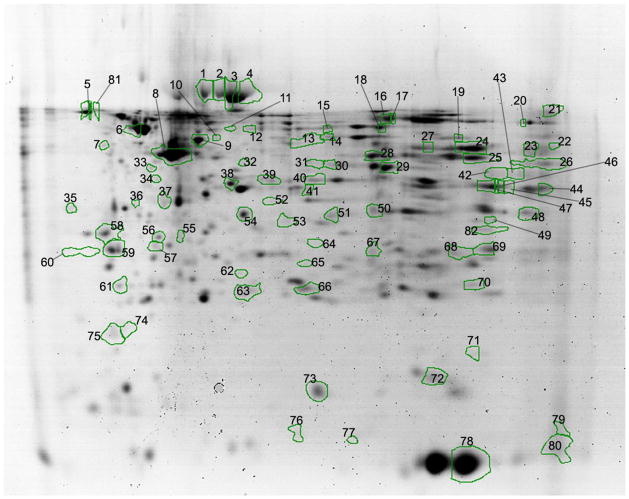
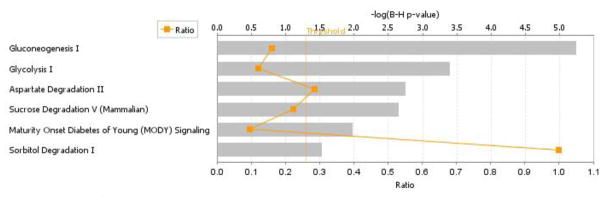
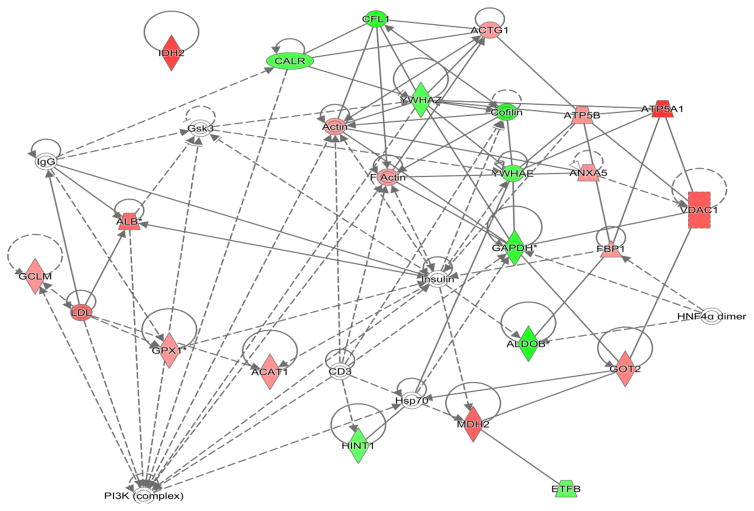
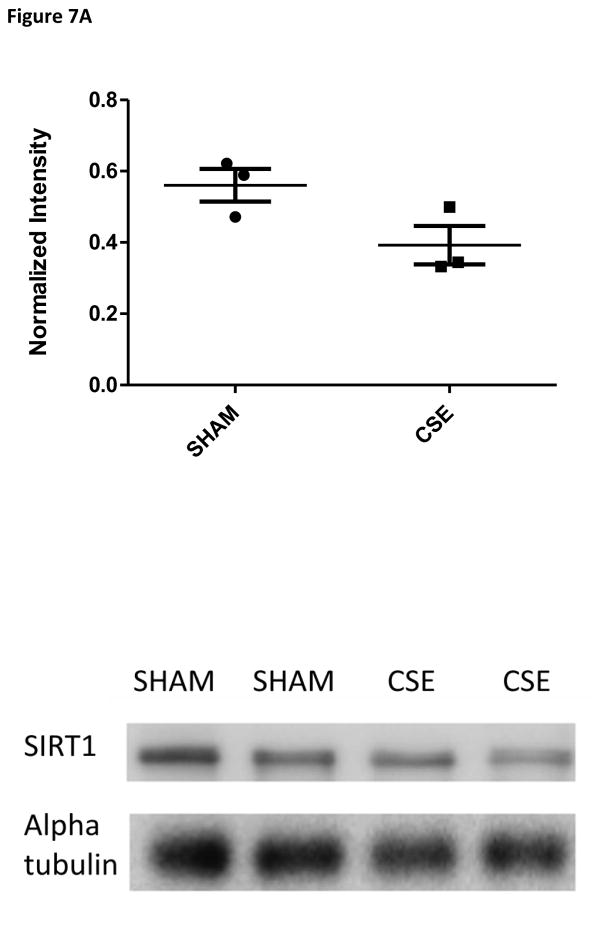
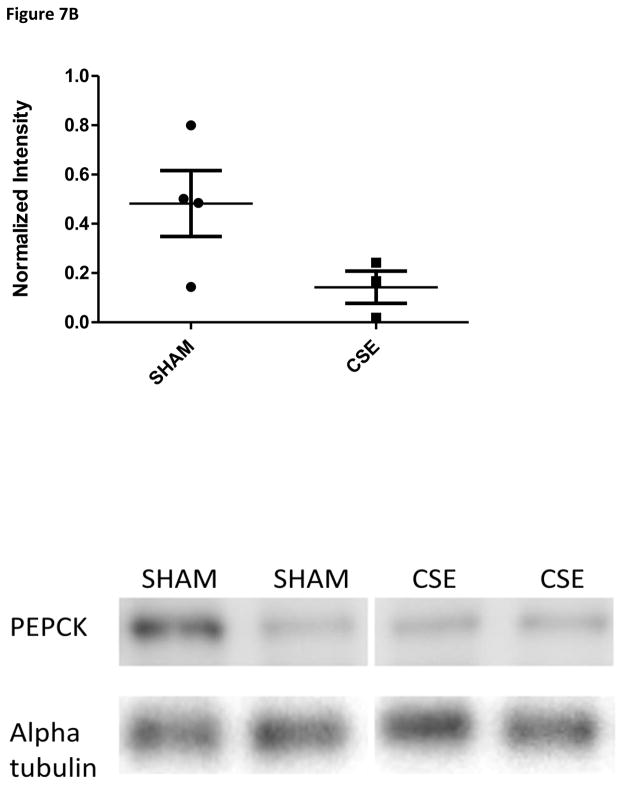
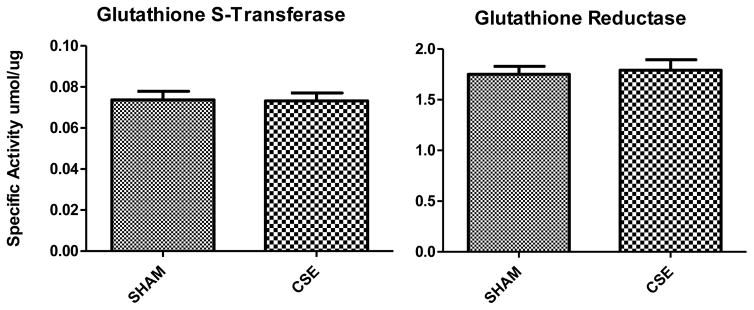
Cigarette smoke exposure (CSE) during gestation and early development suppresses the growth trajectory in offspring. In prior studies utilizing a mouse model of 'active' developmental CSE (GD1-PD21), low birth weight induced by CSE persisted throughout the neonatal period and was present at the cessation of exposure at weaning with proportionally smaller kidney mass that was accompanied by impairment of carbohydrate metabolism. In the present study, littermates of those characterized in the prior study were maintained until 6 months of age at which time the impact of developmental CSE on the abundance of proteins associated with cellular metabolism in the kidney was examined. Kidney protein abundances were examined by 2D-SDS-PAGE based proteome profiling with statistical analysis by Partial Least Squares-Discriminant Analysis. Key findings of this study include a persistence of impact of developmental CSE past the original exposure period on the nucleic acid and carbohydrate metabolism networks and oxidant scavenging pathways.

Keywords: CSE; Developmental cigarette smoke exposure; Inhalation; Kidney; Mouse; Proteome; Tobacco.


Figures

Figure 1
Figure 1. Kidney tissue wet weights were reduced at 6 months of age following developmental exposure to cigarette smoke (GD1-PD21)
Kidneys from offspring exposed to either filtered air (SHAM, n=9) or a protocol of "active" cigarette smoking (CSE, n=8) during development were weighed following animal euthanization at 6 months of age (*p<0.05). Long horizontal lines indicate mean weight, with the standard deviation represented by the shorter horizontal bars.
Figure 2
Figure 2. Side-by-side comparison of protein spot patterns of kidney from the Sham and developmental CSE groups
A side-by-side comparison of kidney protein spot separation based on isoelectric focusing point (horizontal) and molecular weight (vertical) in the two experimental groups (Sham-left; CSE-right). The gels are similar with regard to the number of spots without the appearance or loss of spots between groups.
Figure 3
Figure 3
Figure 3A: Variable importance in projection. Protein spots present on gels from the Sham and developmental CSE groups were analyzed by PLS-DA (n=9 per group, biological replicates). Description of the separation of groups by latent factors found that 99% of the variance between groups could be described by two latent factors. Figure 3B: Plotting latent factors from the PLS-DA model shows differences in the kidney protein spot patterns of the Sham and developmental CSE groups at 6 months of age. All protein spots (excluding noise) were included in the calculation of VIP rankings and the graphing of the separation of groups by latent factors.
Figure 4
Figure 4. Kidney proteome profiles of 6 month old offspring previously developmentally exposed to cigarette smoke
The proteins with altered abundance that contributed to the separation of the groups within the PLS-DA model and possessed the highest VIP values (≥1.75) are numbered (as well as a limited selection of unaltered proteins) Refer to Tables 1–3, for a listing of proteins identified in each spot.
Figure 5
Figure 5. The top six ranked protein interaction networks and pathways impacted within the liver of adult offspring who were previously developmentally exposed to cigarette smoke
The distance from the threshold value (vertical, orange line) depicts the intensity of change between Sham exposure and CSE groups.
Figure 6
Figure 6. Nucleic acid metabolism, small molecule biochemistry, and carbohydrate metabolism pathways in the adult kidney affected by developmental CSE
Kidney proteins identified as contributing to the separation of groups (Sham exposed and CSE) are shadowed and connected to the network by arrows denoting directionality of interaction. Solid lines indicated a direct interaction while dotted lines indicate an indirect interaction. Geometric shapes identify classes of proteins: phosphatases (triangle), kinases (inverted triangle), enzymes (vertical diamond), transcription regulators (horizontal ellipse), transporters (trapezoid), and other important molecules (circles). Red indicates increased abundance while green indicates decreased abundance in the CSE group. Abbreviations are defined in Tables 1 and 2.
Figure 7
Figure 7
Figure 7A: Western blot analysis of SIRT1 expression in whole kidney homogenates from 6 month old offspring previously exposed on GD1-PD21 to cigarette smoke. Kidney homogenates from CSE offspring at age 6 months exhibited a decrease of approximately 30% in expression of the metabolic regulatory protein SIRT1 when compared to Sham exposed (*p<0.05; n=3 per group). Long horizontal lines indicate mean signal intensity, with the standard deviation represented by the shorter horizontal bars. Figure 7B: Western blot analysis of PEPCK expression in whole kidney homogenates from 6 month old offspring previously exposed GD1-PD21 to cigarette smoke. Kidney homogenates from CSE offspring at age 6 months exhibited an increase of approximately 70% in PEPCK expression in the fed state when compared to Sham exposed (*p<0.05; n=4 per group). Long horizontal lines indicate mean signal intensity, with the standard deviation represented by the shorter horizontal bars.
Figure 7
Figure 7
Figure 7A: Western blot analysis of SIRT1 expression in whole kidney homogenates from 6 month old offspring previously exposed on GD1-PD21 to cigarette smoke. Kidney homogenates from CSE offspring at age 6 months exhibited a decrease of approximately 30% in expression of the metabolic regulatory protein SIRT1 when compared to Sham exposed (*p<0.05; n=3 per group). Long horizontal lines indicate mean signal intensity, with the standard deviation represented by the shorter horizontal bars. Figure 7B: Western blot analysis of PEPCK expression in whole kidney homogenates from 6 month old offspring previously exposed GD1-PD21 to cigarette smoke. Kidney homogenates from CSE offspring at age 6 months exhibited an increase of approximately 70% in PEPCK expression in the fed state when compared to Sham exposed (*p<0.05; n=4 per group). Long horizontal lines indicate mean signal intensity, with the standard deviation represented by the shorter horizontal bars.
Figure 8
Figure 8. Antioxidant enzymatic activity in kidney of Sham and developmental CSE offspring at age 6 months
Antioxidant enzyme specific activity was not compromised in the kidney of CSE offspring (n=4 per group).

References

    1. Li XY, Rahman I, Donaldson K, MacNee W. Mechanisms of cigarette smoke induced increased airspace permeability. Thorax. 1996;51:465–71. - PMC - PubMed
    1. Sisman AR, Bulbul M, Coker C, Onvural B. Cadmium exposure in tobacco workers: possible renal effects. J Trace Elem Med Biol. 2003;17:51–5. - PubMed
    1. Kyerematen GA, Vesell ES. Metabolism of nicotine. Drug Metab Rev. 1991;23:3–41. - PubMed
    1. Shah PK, Helfant RH. Smoking and coronary artery disease. Chest. 1988;94:449–52. - PubMed
    1. Marcilla A, Martinez I, Berenguer D, Gomez-Siurana A, Beltran MI. Comparative study of the main characteristics and composition of the mainstream smoke of ten cigarette brands sold in Spain. Food Chem Toxicol. 2012;50:1317–33. - PubMed

Publication types