. 2016 May 21;16(1):115.
doi: 10.1186/s12870-016-0800-x.

Drought stress tolerance strategies revealed by RNA-Seq in two sorghum genotypes with contrasting WUE

Affiliations

Drought stress tolerance strategies revealed by RNA-Seq in two sorghum genotypes with contrasting WUE

Alessandra Fracasso et al. BMC Plant Biol. .

Abstract

Background: Drought stress is the major environmental stress that affects plant growth and productivity. It triggers a wide range of responses detectable at molecular, biochemical and physiological levels. At the molecular level the response to drought stress results in the differential expression of several metabolic pathways. For this reason, exploring the subtle differences in gene expression of drought sensitive and drought tolerant genotypes enables the identification of drought-related genes that could be used for selection of drought tolerance traits. Genome-wide RNA-Seq technology was used to compare the drought response of two sorghum genotypes characterized by contrasting water use efficiency.

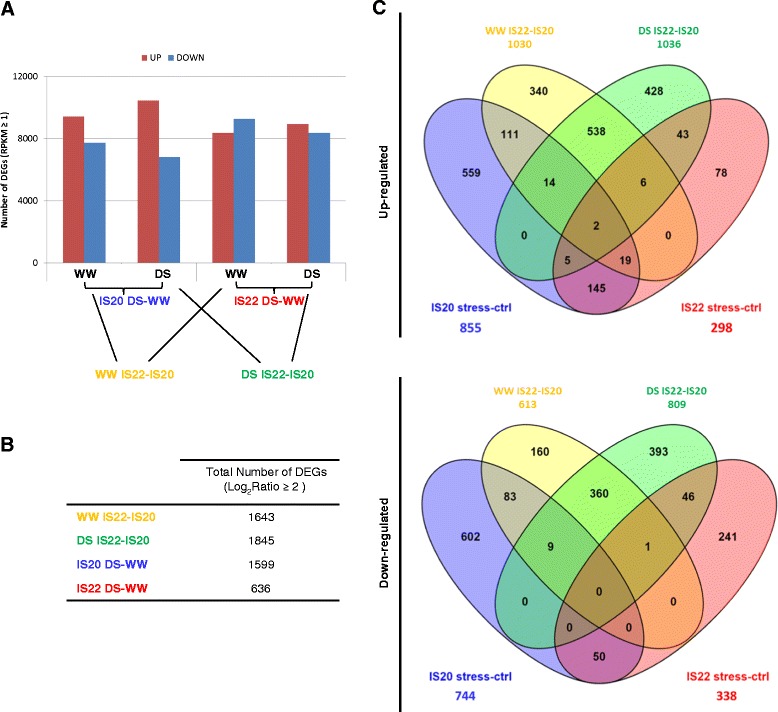
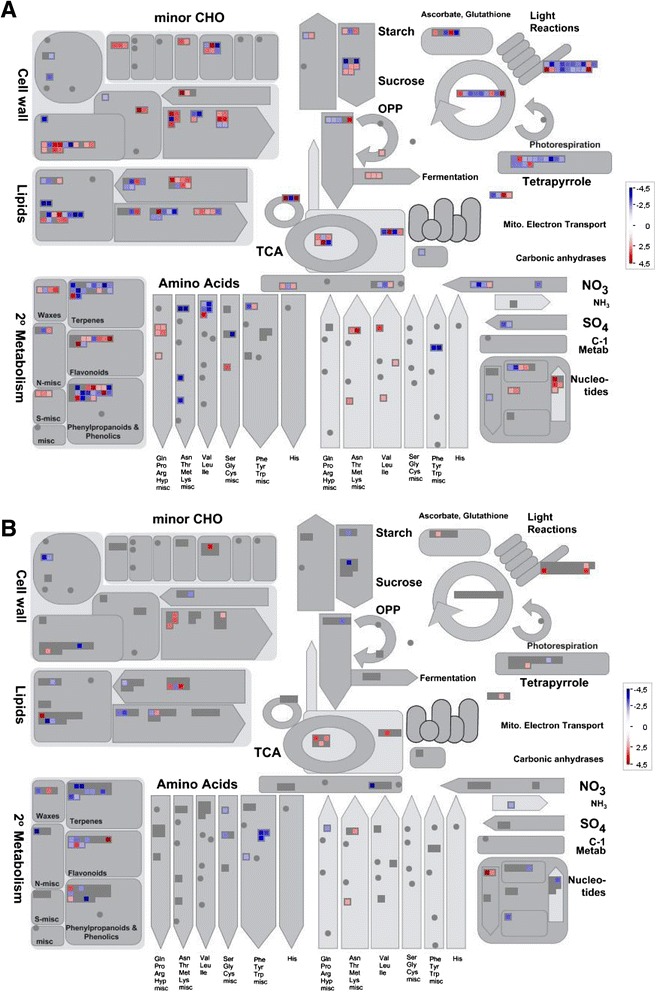
Results: The physiological measurements carried out confirmed the drought sensitivity of IS20351 and the drought tolerance of IS22330 genotypes, as previously studied. The expression of drought-related genes was more abundant in the drought sensitive genotype IS20351 compared to the tolerant genotype IS22330. Under drought stress Gene Ontology enrichment highlighted a massive increase in transcript abundance in the sensitive genotype IS20351 in "response to stress" and "abiotic stimulus", as well as for "oxidation-reduction reaction". "Antioxidant" and "secondary metabolism", "photosynthesis and carbon fixation process", "lipids" and "carbon metabolism" were the pathways most affected by drought in the sensitive genotype IS20351. In addition, genotype IS20351 showed a lower constitutive expression level of "secondary metabolic process" (GO:0019748) and "glutathione transferase activity" (GO:000004364) under well-watered conditions.

Conclusions: RNA-Seq analysis proved to be a very useful tool to explore differences between sensitive and tolerant sorghum genotypes. Transcriptomics analysis results supported all the physiological measurements and were essential to clarify the tolerance of the two genotypes studied. The connection between differential gene expression and physiological response to drought unequivocally revealed the drought tolerance of genotype IS22330 and the strategy adopted to cope with drought stress.

Keywords: Drought stress; Drought tolerance; RNA-Seq; Sorghum bicolor; Water Use Efficiency.


Figures

Fig. 1
Fig. 1
Trend of FTSW and daily transpired water during the dry-down experiment. On the left axis with circles symbols the trend of FTSW during the dry-down: with full circles the WW plants and with the empty circles the DS ones. On the right axis with triangles the daily transpired water: full triangles for the WW plants and empty triangles for the DS ones. DAE = days after emergence. Mean of 10 plants ± SE
Fig. 2
Fig. 2
Trend of WUEi calculated during the dry down experiment. Circles represent the sensitive genotype IS20351 and triangles the tolerant IS22330. For both the genotypes the full symbols represents the WW plants whilst the empty symbols represent the DS ones. Mean of 10 plants ± SE
Fig. 3
Fig. 3
Comparison under study. a Number of DEGs (RPKM) in each pairwise comparison. Blue and red bar are up- an down-regulated genes respectively expressed in well-watered (WW) and drought stressed (DS) conditions in the genotypes IS20351 (IS20) and IS22330 (IS22). b Total number of DEGs that passed the cut-off of Log2 FC >2 in each comparison. In yellow the number of DEGs resulting from the comparison between IS20351 and IS22330 in well-watered (WW) conditions, in green the number of DEGs resulting from the comparison between the two genotypes under drought stress (DS) conditions; in blue the numbers of DEGs in response to drought stress in IS20351 and in red the number of DEGs in response to drought stress in IS22330. c Venn diagram showing the numbers of up- and down- regulated genes resulted from the four comparison performed. The number of up- or down- regulated genes shared among the four comparison is represented by overlapping circles
Fig. 4
Fig. 4
Heat map showing the 20 common GO terms enriched under drought stress in sorghum leaves of IS20351 and IS22330. The cluster frequency was used as a parameter for the parametric analysis of gene enrichment analysis. The figure was generated using R software, Limma package
Fig. 5
Fig. 5
Number of up- and down-regulated genes in each clade of the KEGG pathway maps. The 171 unigenes were assigned 112 KEGG pathways within 24 clades under five major categories: “organismal systems” (I), “cellular processes” (II), “environmental information processing” (III), “genetic information processing” (IV), “metabolism” (V). Per each clades are shown the up- (in red) and the down- (in blue) regulated genes
Fig. 6
Fig. 6
Distribution in KEGG pathways of the unique up- and down-regulated genes in response to drought for the genotype IS20351 and IS22330. Pie charts showing the percentage of genes up- (in red) and down- (in blue) regulated in response to drought stress for the genotypes IS20351 (a) and IS22330 (b)
Fig. 7
Fig. 7
Distribution of up- (in red) and down- (in blue) regulated genes in metabolic pathways in response to drought stress for IS20351 and IS22330. Drought mediated expression changes in the metabolic pathways in leaves of IS20351 (a) and IS22330 (b). The figure was generated using MapMan and shows DEGs that passed the cut-off of Log2 FC >2

References

    1. Zhang HP. Improving water productivity through deficit irrigation: examples from Syria, the North China Plain and Oregon, USA. In: Kijne J, Barker R, Molden D, editors. Water productivity in agriculture: limits and opportunities for improvement. Wallingford: CABI; 2003. p. 332.
    1. Rooney WL, Blumenthal J, Bean B, Mullet J. Designing sorghum as a dedicated bioenergy feedstock. Biofuel, Bioprod Bioref. 2007;1:147–57. doi: 10.1002/bbb.15. - DOI
    1. Dugas DV, Monaco MK, Olsen A, Klein RR, Kumari S, Ware D, et al. Functional annotation of the transcriptome of Sorghum bicolor in response to osmotic stress and abscisic acid. BMC Genomics. 2011;12:514–19. - PMC - PubMed
    1. Paterson AH, Bowers JE, Bruggmann R, Dubchak I, Grimwood J, Gundlach H, et al. The Sorghum bicolor genome and the diversification of grasses. Nature. 2009;457(7229):551–56. - PubMed
    1. Sanchez AC, Subudhi PK, Rosenow DT, Nguyen HT. Mapping QTLs associated with drought resistance in sorghum (Sorghum bicolor L. Moench) Plant Mol Biol. 2002;48(5–6):713–26. doi: 10.1023/A:1014894130270. - DOI - PubMed

Publication types