

The clinical significance of the MIF homolog d-dopachrome tautomerase (MIF-2) and its circulating receptor (sCD74) in burn
- PMID: 27209369
- PMCID: PMC5010466
- DOI: 10.1016/j.burns.2016.02.005
The clinical significance of the MIF homolog d-dopachrome tautomerase (MIF-2) and its circulating receptor (sCD74) in burn
Abstract
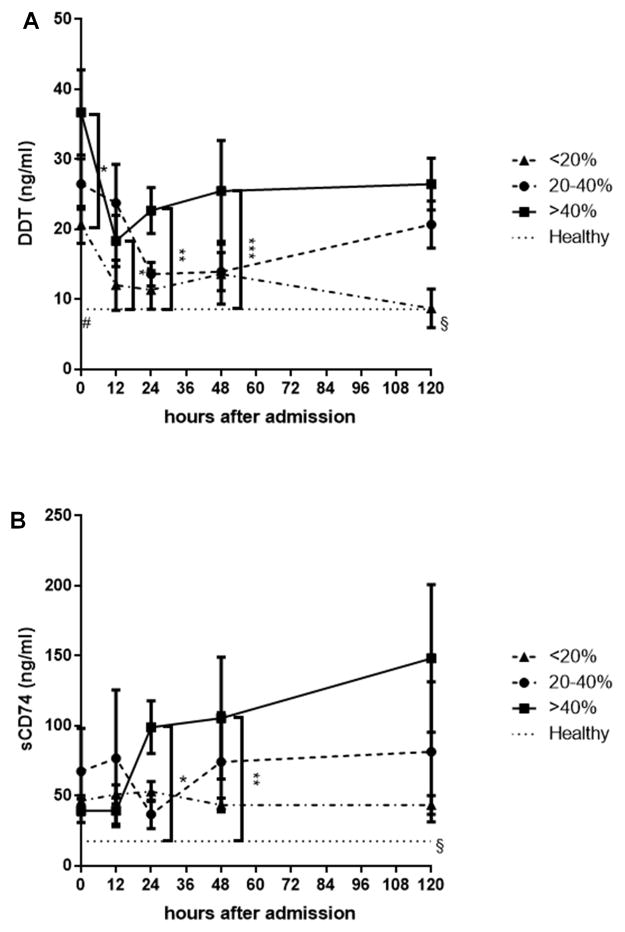
Background: We reported earlier that the cytokine macrophage migration inhibitory factor (MIF) is a potential biomarker in burn injury. In the present study, we investigated the clinical significance of the newly discovered MIF family member d-dopachrome tautomerase (DDT or MIF-2) and their common soluble receptor CD74 (sCD74) in severely burned patients.
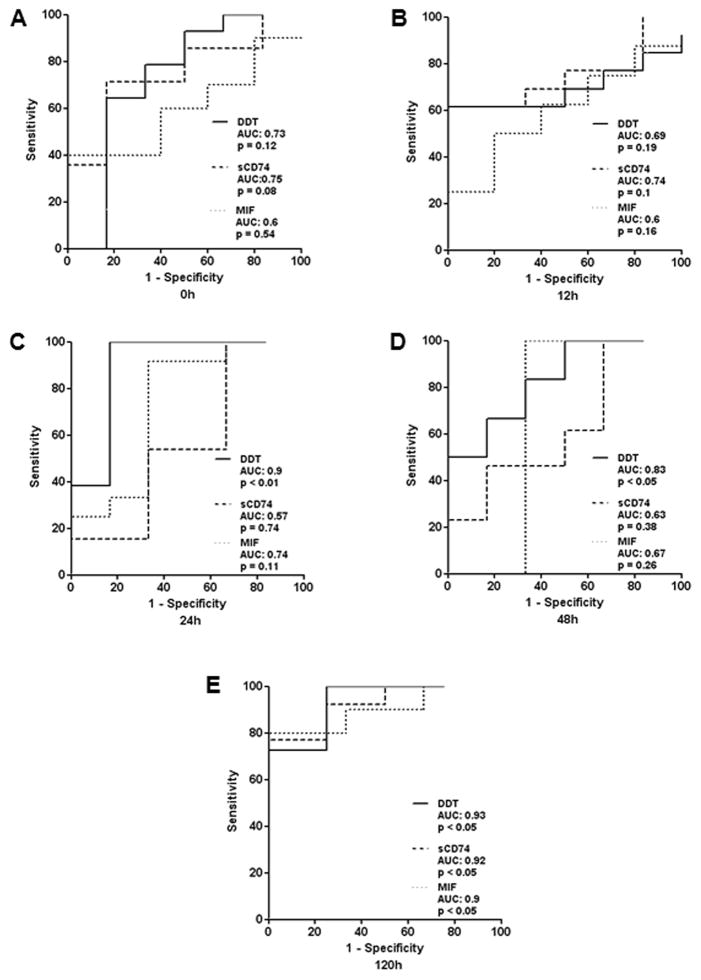
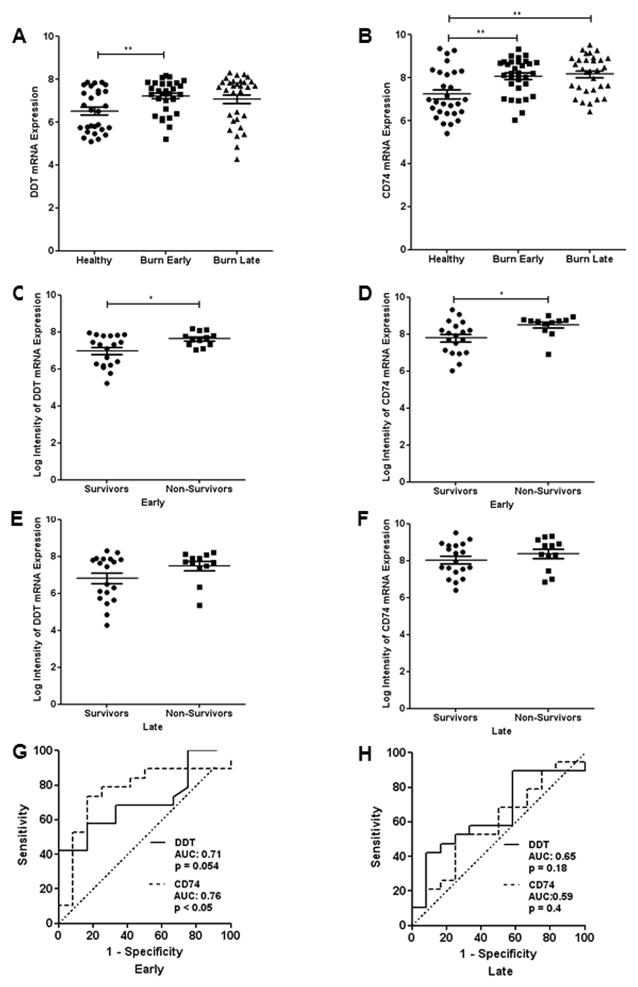
Methods: DDT and sCD74 serum levels were measured 20 severely burned patients and 20 controls. Serum levels were correlated to the abbreviated burn severity index (ABSI) and total body surface area (TBSA) followed by receiver operating characteristic (ROC) analysis. Data were supported by gene expression dataset analysis of 31 burn patients and 28 healthy controls.
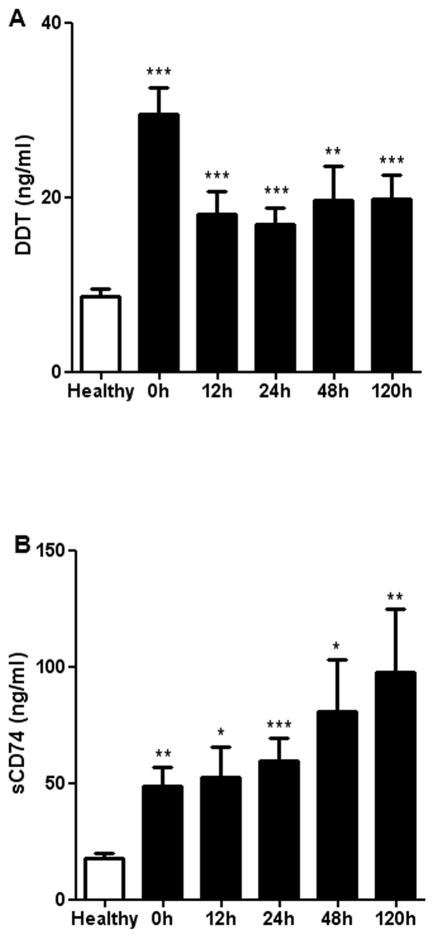
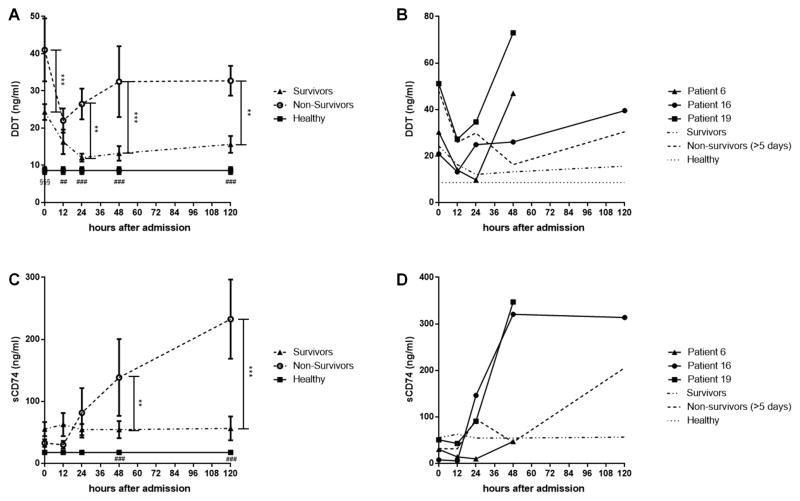
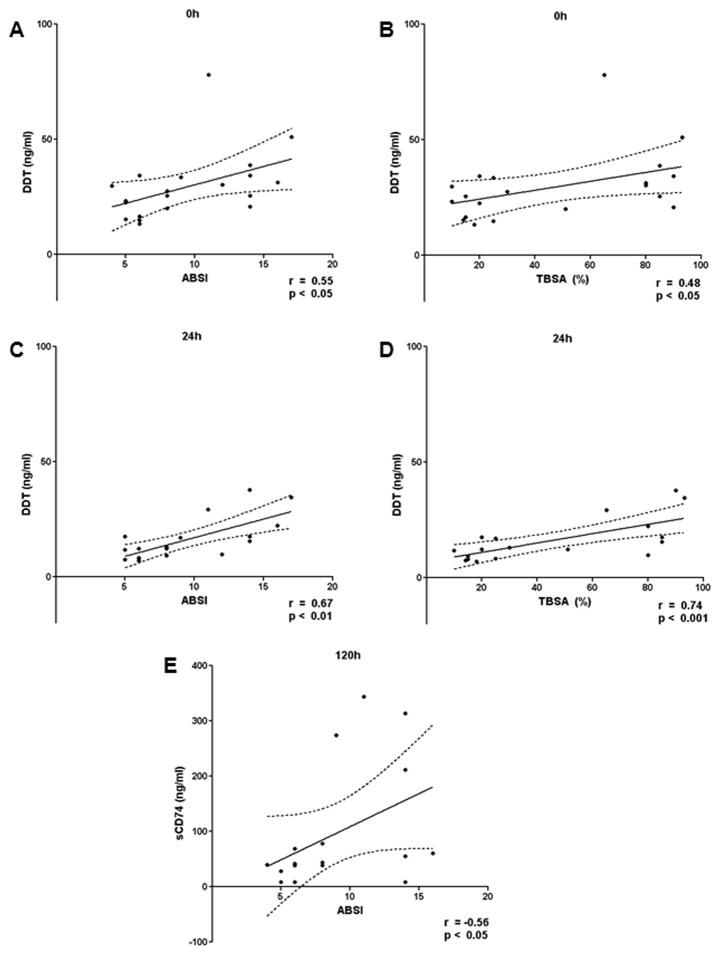
Results: CD74 and DDT were increased in burn patients. Furthermore, CD74 and DDT also were elevated in septic non-survivors when compared to survivors. Serum levels of DDT showed a positive correlation with the ABSI and TBSA in the early stage after burn, and the predictive character of DDT was strongest at 24h. Serum levels of CD74 only correlated with the ABSI 5 days after injury.
Conclusions: DDT may assist in the monitoring of clinical outcome and prediction of sepsis during the early post-burn period. Soluble CD74 and MIF, by contrast, have limited value as an early predictor of death due to their delayed response to burn.
Keywords: Biomarker; Burn; CD74; DDT; MIF; Sepsis.
Copyright © 2016 Elsevier Ltd and ISBI. All rights reserved.
Conflict of interest statement
All authors declare no conflict of interest.
Figures
Similar articles
-
Interaction of MIF Family Proteins in Myocardial Ischemia/Reperfusion Damage and Their Influence on Clinical Outcome of Cardiac Surgery Patients.Antioxid Redox Signal. 2015 Oct 10;23(11):865-79. doi: 10.1089/ars.2014.6243. Epub 2015 Aug 11. Antioxid Redox Signal. 2015. PMID: 26234719 Free PMC article.
-
Elevated MIF-2 levels predict mortality in critically ill patients.J Crit Care. 2017 Aug;40:52-57. doi: 10.1016/j.jcrc.2017.03.012. Epub 2017 Mar 16. J Crit Care. 2017. PMID: 28329734
-
Prognostic and therapeutic insights into MIF, DDT, and CD74 in melanoma.Oncotarget. 2024 Jul 19;15:507-520. doi: 10.18632/oncotarget.28615. Oncotarget. 2024. PMID: 39028303 Free PMC article.
-
MIF, CD74 and other partners in kidney disease: tales of a promiscuous couple.Cytokine Growth Factor Rev. 2013 Feb;24(1):23-40. doi: 10.1016/j.cytogfr.2012.08.001. Epub 2012 Sep 7. Cytokine Growth Factor Rev. 2013. PMID: 22959722 Review.
-
Immune modulation by the macrophage migration inhibitory factor (MIF) family: D-dopachrome tautomerase (DDT) is not (always) a backup system.Cytokine. 2020 Sep;133:155121. doi: 10.1016/j.cyto.2020.155121. Epub 2020 May 11. Cytokine. 2020. PMID: 32417648 Review.
Cited by
-
Soluble CD74 Reroutes MIF/CXCR4/AKT-Mediated Survival of Cardiac Myofibroblasts to Necroptosis.J Am Heart Assoc. 2018 Sep 4;7(17):e009384. doi: 10.1161/JAHA.118.009384. J Am Heart Assoc. 2018. PMID: 30371153 Free PMC article.
-
Differential regulation of macrophage activation by the MIF cytokine superfamily members MIF and MIF-2 in adipose tissue during endotoxemia.FASEB J. 2020 Mar;34(3):4219-4233. doi: 10.1096/fj.201901511R. Epub 2020 Jan 21. FASEB J. 2020. PMID: 31961019 Free PMC article.
-
D-dopachrome tautomerase from Japanese sea bass ( Lateolabrax japonicus) is a chemokine-like cytokine and functional homolog of macrophage migration inhibitory factor.Zool Res. 2020 Jan 18;41(1):39-50. doi: 10.24272/j.issn.2095-8137.2020.003. Zool Res. 2020. PMID: 31709785 Free PMC article.
-
Hallmarks of Cancer Affected by the MIF Cytokine Family.Cancers (Basel). 2023 Jan 6;15(2):395. doi: 10.3390/cancers15020395. Cancers (Basel). 2023. PMID: 36672343 Free PMC article. Review.
-
Distinct patterns of serum and urine macrophage migration inhibitory factor kinetics predict death in sepsis: a prospective, observational clinical study.Sci Rep. 2023 Jan 11;13(1):588. doi: 10.1038/s41598-023-27506-6. Sci Rep. 2023. PMID: 36631486 Free PMC article.
References
-
- Chipp E, Milner CS, Blackburn AV. Sepsis in burns: a review of current practice and future therapies. Ann Plast Surg. 2010;65:228–36. - PubMed
-
- Rex S, Kraemer S, Grieb G, Emontzpohl C, Soppert J, Goetzenich A, et al. The role of macrophage migration inhibitory factor in critical illness. Mini Rev Med Chem. 2014;14:1116–24. - PubMed
-
- Grieb G, Simons D, Piatkowski A, Bernhagen J, Steffens G, Pallua N. Macrophage migration inhibitory factor-A potential diagnostic tool in severe burn injuries? Burns : journal of the International Society for Burn Injuries. 2010;36:335–42. - PubMed
MeSH terms
Substances
Grants and funding
LinkOut - more resources
Full Text Sources
Other Literature Sources
Medical
Miscellaneous
