Clinical Trial
. 2016 Jun;38(6):1327-1339.
doi: 10.1016/j.clinthera.2016.04.032. Epub 2016 May 18.

Correlation Among Hypoglycemia, Glycemic Variability, and C-Peptide Preservation After Alefacept Therapy in Patients with Type 1 Diabetes Mellitus: Analysis of Data from the Immune Tolerance Network T1DAL Trial

Affiliations
Clinical Trial

Correlation Among Hypoglycemia, Glycemic Variability, and C-Peptide Preservation After Alefacept Therapy in Patients with Type 1 Diabetes Mellitus: Analysis of Data from the Immune Tolerance Network T1DAL Trial

Ashley Pinckney et al. Clin Ther. 2016 Jun.

Abstract

Purpose: In natural history studies, maintenance of higher levels of C-peptide secretion (a measure of endogenous insulin production) correlates with a lower incidence of major hypoglycemic events in patients with type 1 diabetes mellitus (T1D), but it is unclear whether this is also true for drug-induced C-peptide preservation.

Methods: We analyzed hypoglycemic events and glycemic control data from the T1DAL (Inducing Remission in New-Onset T1D with Alefacept) study, a trial of alefacept in new-onset T1D, which found significant C-peptide preservation at 1 and 2 years. We performed a post hoc analysis using mixed models of the association between the meal-stimulated 4-hour C-peptide AUC (4-hour AUC) and rates of major hypoglycemia, measures of glycemic control (glycosylated hemoglobin [HbA1c]; mean glucometer readings), and variability (glucometer SDs; highest and lowest readings), and an index of partial remission (insulin dose-adjusted HbA1c[ IDAA1c]).

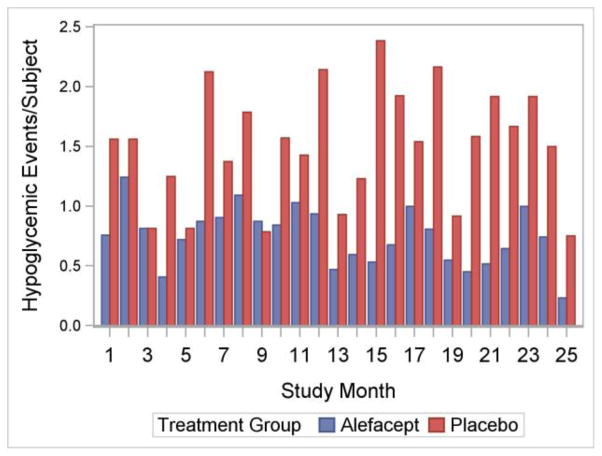
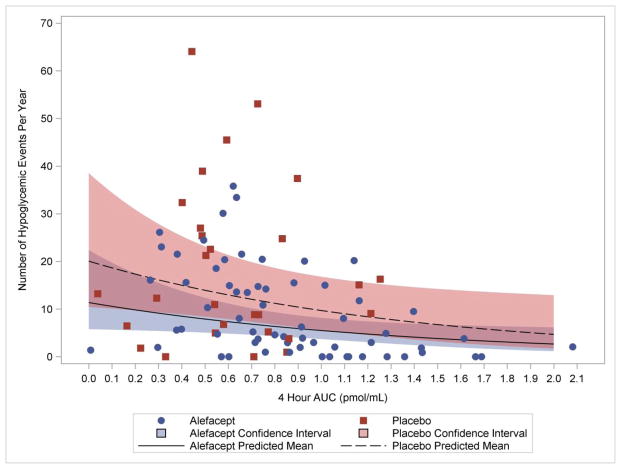
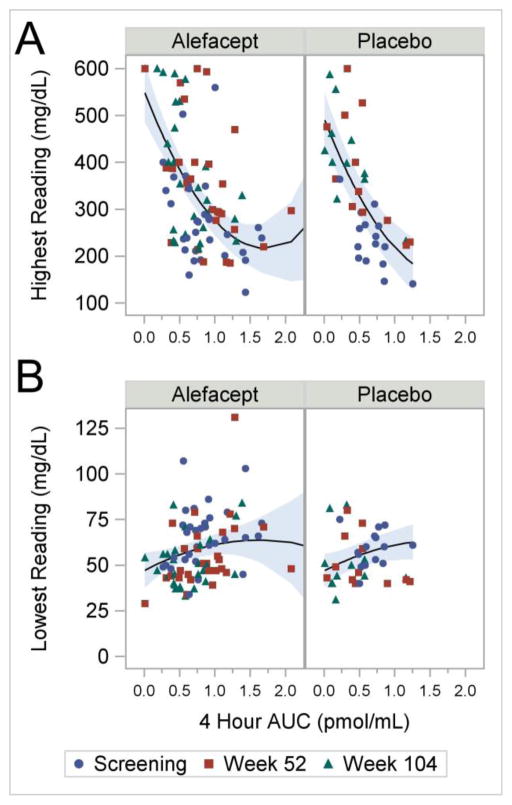
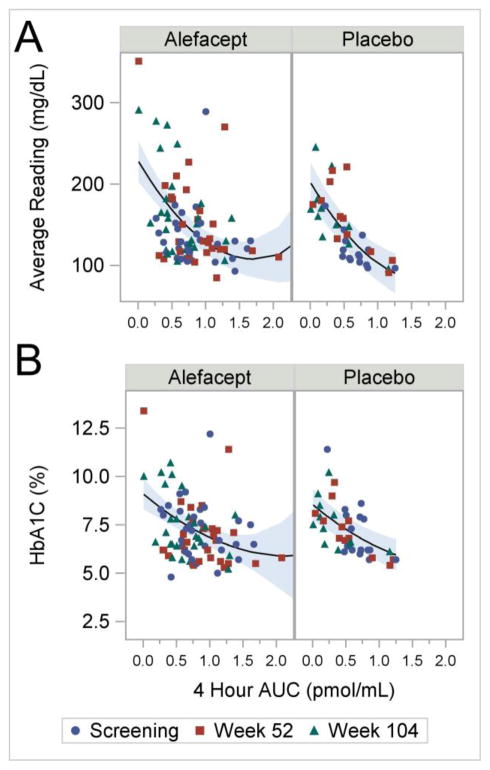
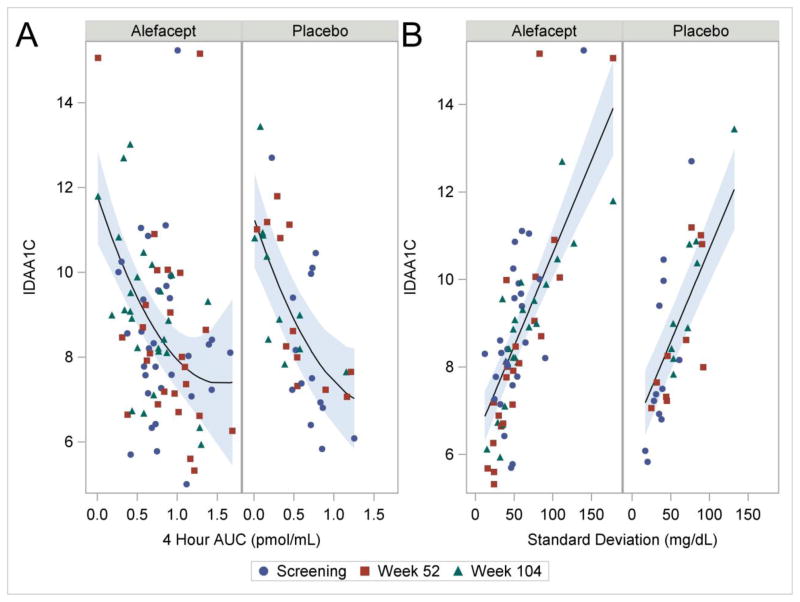
Findings: Data from 49 participants (33 in the alefacept group and 16 in the placebo group) were analyzed at baseline and 12 and 24 months. We found that the 4-hour AUC at baseline and at 1 year was a significant predictor of the number of hypoglycemic events during the ensuing 12-month interval (p = 0.030). There was a strong association between the 4-hour AUC and glucometer SDs (P < 0.001), highest readings (p < 0.001), and lowest readings (p = 0.03), all measures of glycemic variability. There was a strong inverse correlation between the 4-hour AUC and 2 measures of glycemic control: HbA1c and mean glucometer readings (both p < 0.001). There was also a strong inverse correlation between the 4-hour AUC and IDAA1c values (p < 0.001), as well as a strong correlation between IDAA1c values and glucometer SDs (p < 0.001), suggesting that reduced glycemic variability is associated with a trend toward partial remission. None of these analyses found a significant difference between the alefacept and placebo groups.

Implications: Measures of glycemic variability and control, including rates of hypoglycemia, are significantly correlated with preservation of C-peptide regardless of whether this is achieved by immune intervention with alefacept or natural variability in patients with new-onset T1D. Thus, preservation of endogenous insulin production by an immunomodulatory drug may confer clinical benefits similar to those seen in patients with higher C-peptide secretion due to slow disease progression.

Keywords: alefacept; glycemic control; hypoglycemia; immune intervention; islet function; new-onset T1d.


Figures

Figure 1
Figure 1. Major Hypoglycemic Events over Time
The height of each bar equals the total number of hypoglycemic events divided by the number of subject in the study at month x. Treatment groups are represented by different bars.
Figure 2
Figure 2. Major Hypoglycemic Events versus 4-hour AUC
The lines are predicted Poisson means based on the parameter estimates (standard error) for the fitted Gauss-Poisson model: intercept −2.90 (0.324); alefacept −0.57 (0.308); starting AUC −0.73 (0.324), where the reference cell is placebo at AUC=0. P-values are <0.001, 0.07, and 0.03, respectively. The Pearson Chi-Square divided by the degrees of freedom = 0.44, suggesting good model fit. The analysis included 91 observations from 49 subjects. The 4-hour AUC represents the AUC at the start of the interval.
Figure 3
Figure 3. Standard Deviation of Glucometer Readings versus 4-hour AUC
The lines are given by the parameter estimates (standard error) for the fitted model: intercept 98.8 (7.94); alefacept 17.4 (7.12); AUC −101.6 (13.71); AUC2 29.3 (5.95), where the reference cell is placebo at AUC=0. The shaded areas represent 95% confidence intervals. P-values are <0.001, 0.02, <0.001, and <0.001, respectively. The analysis included 111 observations from 49 subjects.
Figure 4
Figure 4
(A) Highest Glucometer Readings versus 4-hour AUC. The lines are given by the parameter estimates (standard error) for the fitted model: intercept 493.5 (30.27); alefacept 57.5 (25.55); AUC −387.5 (58.08); AUC2 112.2 (26.12), where the reference cell is placebo at AUC=0. P-values are <0.001, 0.03, <0.001, and <0.001, respectively. (B) Lowest Glucometer Readings versus 4-hour AUC. The lines are given by the parameter estimates (standard error) for the fitted model: intercept 46.8 (4.56); alefacept 0.22 (4.02); AUC 20.4 (9.99); AUC2 −6.2 (5.43), where the reference cell is placebo at AUC=0. The shaded areas represent 95% confidence intervals. P-values are <0.001, 0.96, 0.04, and 0.26, respectively. The shaded areas represent 95% confidence intervals. Both analyses included 125 observations from 49 subjects.
Figure 5
Figure 5
(A) Average Glucometer Readings versus 4-hour AUC. The lines are given by the parameter estimates (standard error) for the fitted model: intercept 202.5 (12.78); alefacept 26.1 (11.92); AUC −140.8 (21.40); AUC2 41.0 (9.57), where the reference cell is placebo at AUC=0. The shaded areas represent 95% confidence intervals. P-values are <0.001, 0.03, <0.001, and <0.001, respectively. The analysis included 125 observations from 49 subjects. (B) HbA1c versus 4-hour AUC. The lines are given by the parameter estimates (standard error) for the fitted model: intercept 8.5 (0.42); alefacept 0.54 (0.41); AUC −2.9 (0.70); AUC2 0.6 (0.36), where the reference cell is placebo at AUC=0. The shaded areas represent 95% confidence intervals. P-values are <0.001, 0.19, 0.001, and 0.10, respectively. The analysis included 128 observations from 49 subjects.
Figure 6
Figure 6
(A) IDAA1C versus 4-hour AUC. The lines are given by the parameter estimates (standard error) for the fitted model: intercept 11.3 (0.57); alefacept 0.5 (0.54); AUC −5.7 (1.29); AUC2 1.8 (0.86), where the reference cell is placebo at AUC=0. The shaded areas represent 95% confidence intervals. P-values are <0.001, 0.35, <0.001, and 0.04, respectively. The analysis included 120 observations from 49 subjects. (B) IDAA1C versus Standard Deviation of Glucometer Readings. The lines are given by the parameter estimates (standard error) for the fitted model: intercept 6.5 (0.40); alefacept −0.1 (0.40); SD 0.042 (0.0041), where the reference cell is placebo at SD=0. P-values are <0.001, 0.79, <0.001, respectively. The analysis included 120 observations from 49 subjects.

References

    1. Chiang JL, Kirkman MS, Laffel LM, Peters AL Type 1 Diabetes Sourcebook A. Type 1 diabetes through the life span: a position statement of the American Diabetes Association. Diabetes Care. 2014;37:2034–2054. - PMC - PubMed
    1. Atkinson MA, Eisenbarth GS, Michels AW. Type 1 diabetes. Lancet. 2014;383:69–82. - PMC - PubMed
    1. Lind M, Svensson AM, Kosiborod M, et al. Glycemic control and excess mortality in type 1 diabetes. N Engl J Med. 2014;371:1972–1982. - PubMed
    1. Palta M, LeCaire T, Daniels K, Shen G, Allen C, D’Alessio D. Risk factors for hospitalization in a cohort with type 1 diabetes. Wisconsin Diabetes Registry. Am J Epidemiol. 1997;146:627–636. - PubMed
    1. Icks A, Rosenbauer J, Haastert B, Giani G. Hospitalization among diabetic children and adolescents and non-diabetic control subjects: a prospective population-based study. Diabetologia. 2001;44(Suppl 3):B87–92. - PubMed

Publication types

MeSH terms