. 2016 May 23:7:11662.
doi: 10.1038/ncomms11662.

Potent social synchronization can override photic entrainment of circadian rhythms

Affiliations

Potent social synchronization can override photic entrainment of circadian rhythms

Taro Fuchikawa et al. Nat Commun. .

Abstract

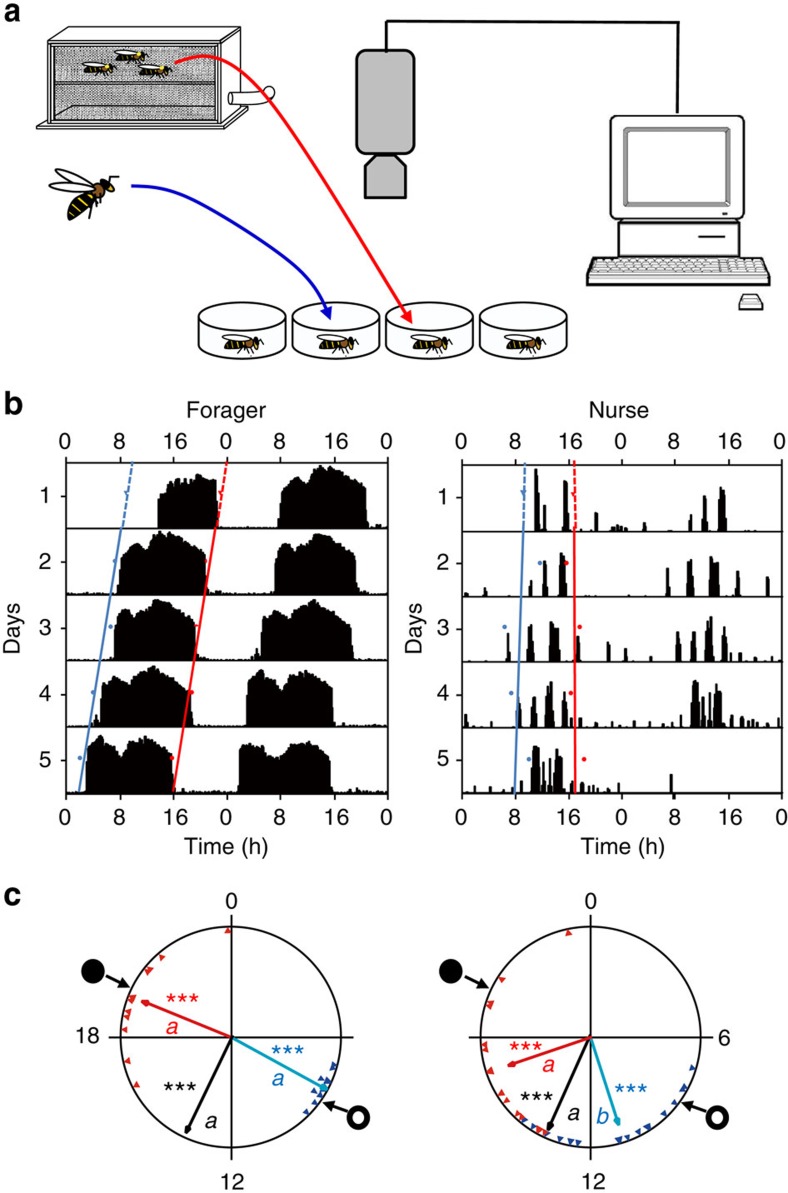
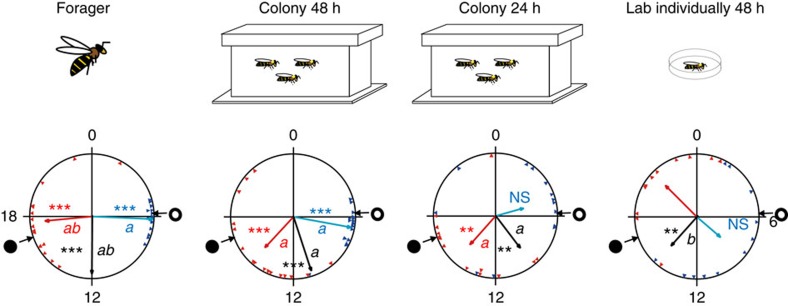
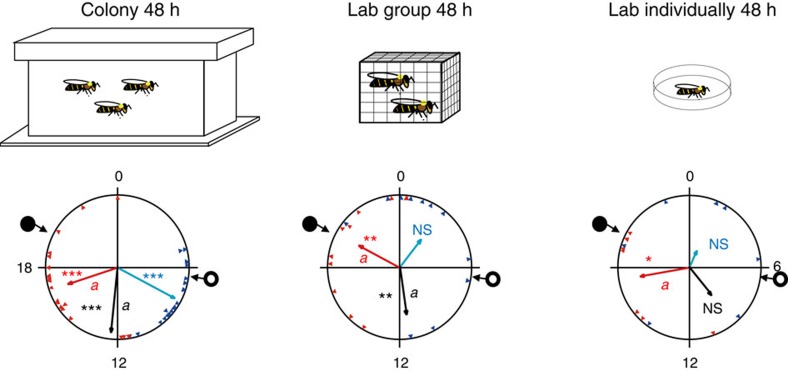
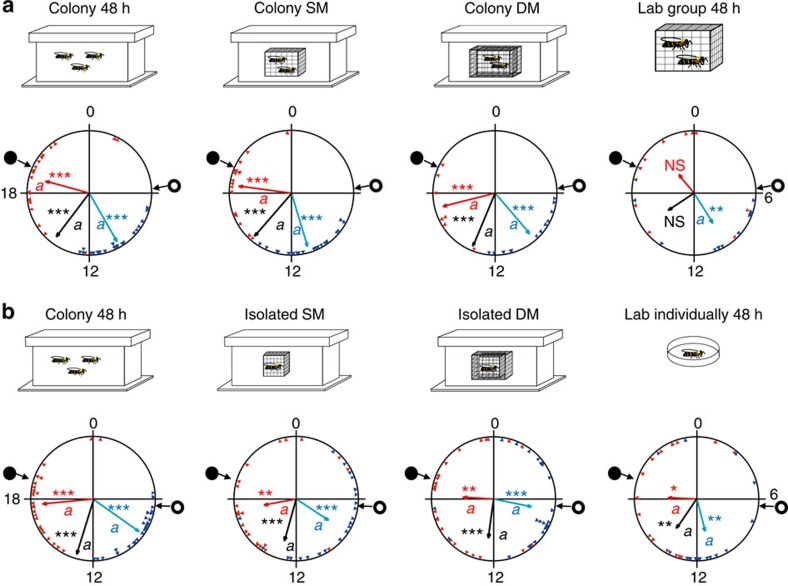
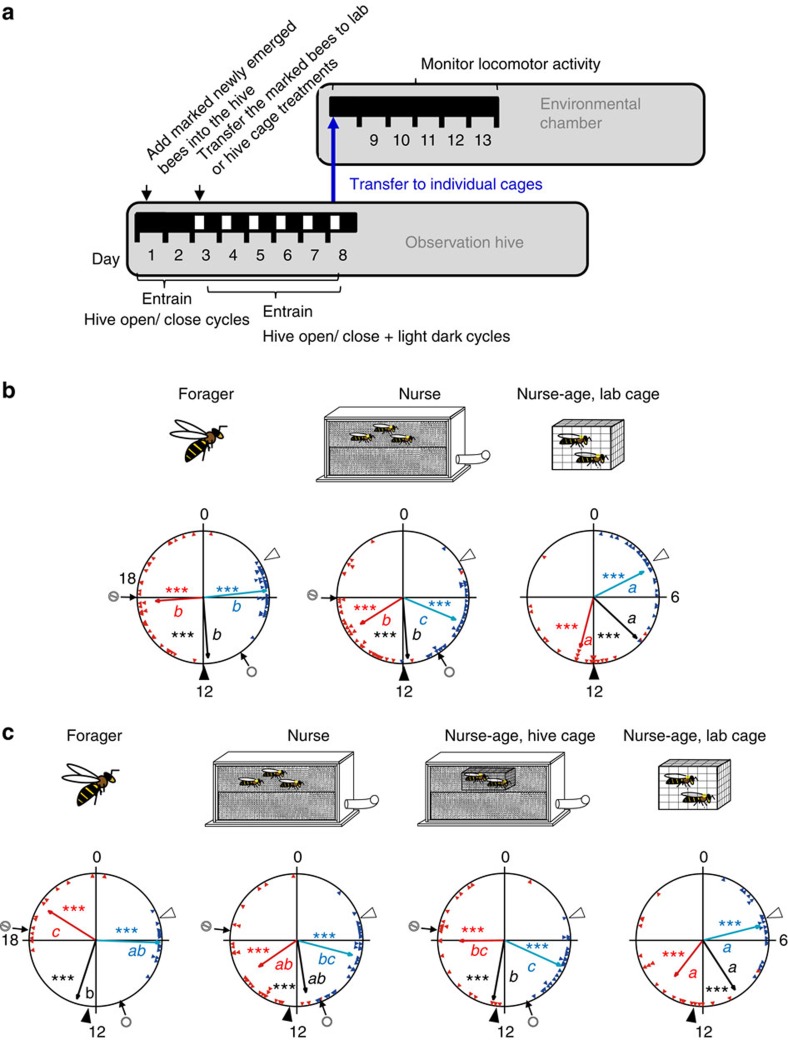
Circadian rhythms in behaviour and physiology are important for animal health and survival. Studies with individually isolated animals in the laboratory have consistently emphasized the dominant role of light for the entrainment of circadian rhythms to relevant environmental cycles. Although in nature interactions with conspecifics are functionally significant, social signals are typically not considered important time-givers for the animal circadian clock. Our results challenge this view. By studying honeybees in an ecologically relevant context and using a massive data set, we demonstrate that social entrainment can be potent, may act without direct contact with other individuals and does not rely on gating the exposure to light. We show for the first time that social time cues stably entrain the clock, even in animals experiencing conflicting photic and social environmental cycles. These findings add to the growing appreciation for the importance of studying circadian rhythms in ecologically relevant contexts.


Figures

Figure 1
Figure 1. Nurses removed from field-foraging colonies are synchronized to the day–night cycle outside.
(a) Experimental procedure. Nurses and foragers were collected from a field-foraging observation hive. The hive was constantly dark but foragers exited the hive and are assumed to have experienced 12 h light (natural light)/12 h dark (LD) cycles. On the eighth day, we collected foragers and nurses, placed each individually in a cage and monitored their locomotor activity for 5 days in constant conditions. (b) Representative double-plot actograms. Each panel shows locomotor activity for an individual bee monitored in constant laboratory environment. The y axis depicts days in the monitoring cage; the height of the bars within each day corresponds to the level of locomotor activity in a 10-min bin. The blue and red dots show the time of onset and offset of activity for each day, respectively. Regression lines with corresponding colours are fitted to these points. The time of onset and offset on the day on which the bee was transferred from the hive to the laboratory (day 1) was extrapolated from the regression models. (c) Representative circular statistics for sister nurses and foragers from colony H7. The time of day is depicted on the circular plot perimeter. The open and filled circles on the perimeter delineate the time of sunrise and sunset, respectively. The blue and red triangles depict the onset and offset for individual bees, respectively. The blue, black and red vectors (arrows) pointing from the centre towards the perimeter show the average time for the onset, median and offset, respectively. Vector length corresponds to the extent of phase coherence. Asterisks in matching colours correspond to the P-value obtained from a Rayleigh test for phase coherence (*0.01<P<0.05, **0.001<P<0.01 and ***P<0.001). The median for each bee (points for individual bees are not shown) was calculated as the midpoint between the onset and offset. Vectors sharing the same colour across different plots, and which are marked with different small letters, are significantly different in a Watson–Williams F-test across experimental groups. Sample size is 11 and 17 for foragers and nurses, respectively.
Figure 2
Figure 2. Forty-eight hours in the hive are sufficient for strong synchronization of newly emerged bees to the colony phase.
Representative circular statistics for foragers and callow bees from colony H11. ‘Colony 48 h'—young bees that experienced their first 48 h in a field colony and then monitored individually in constant laboratory conditions. ‘Colony 24 h'—same as above, but bees experienced the colony environment for only 24 h. ‘Lab individually 48 h'—young bees that experienced their first 48 h isolated individually and then monitored individually in constant laboratory conditions. The open and filled circles on the perimeter delineate the time of sunrise and sunset, respectively. The blue and red triangles depict the onset and offset for individual bees, respectively. The blue, black and red vectors (arrows) pointing from the centre towards the perimeter show the average time for the onset, median and offset, respectively. Vector length corresponds to the extent of phase coherence. Asterisks in matching colours correspond to the P-value obtained from a Rayleigh test for phase coherence (*0.01<P<0.05, **0.001<P<0.01 and ***P<0.001). The median for each bee (points for individual bees are not shown) was calculated as the midpoint between the onset and offset. Vectors sharing the same colour across different plots, and which are marked with different small letters, are significantly different in a Watson-Williams F-test with Bonferroni post-hoc tests across experimental groups. Sample sizes are 15, 17, 13 and 11 for ‘Forager', ‘Colony 48 h', ‘Colony 24 h' and ‘Lab individually 48 h', respectively. The cartoons at the top summarize the social conditions experienced by the bees before transferring to locomotor activity monitoring cages in the laboratory.
Figure 3
Figure 3. Social interactions with 30 bees produce weaker synchronization than the hive environment.
Representative circular statistics for callow bees from colony H6. ‘Lab group 48 h'—young bees that experienced their first 48 h in a cage with 30 other same-age bees before being monitored individually in constant laboratory conditions. The open and filled circles on the perimeter delineate the time of sunrise and sunset, respectively. The blue and red triangles depict the onset and offset for individual bees, respectively. The blue, black and red vectors (arrows) pointing from the centre towards the perimeter show the average time for the onset, median and offset, respectively. Vector length corresponds to the extent of phase coherence. Asterisks in matching colours correspond to the P-value obtained from a Rayleigh test for phase coherence (*0.01<P<0.05, **0.001<P<0.01 and ***P<0.001). The median for each bee (points for individual bees are not shown) was calculated as the midpoint between the onset and offset. Vectors sharing the same colour across different plots, and which are marked with different small letters, are significantly different in a Watson-Williams F-test with Bonferroni post-hoc tests across experimental groups. Sample sizes are 21, 11 and 7 for ‘Colony 48 h', ‘Lab group 48 h' and ‘Lab individually 48 h', respectively. The cartoons at the top summarize the social conditions experienced by the bees before transferring to locomotor activity monitoring cages in the laboratory.
Figure 4
Figure 4. Direct contact with other bees is not needed for entrainment by the colony environment.
(a) Representative circular statistics for callow bees from colony H2. ‘Colony SM'—young bees that were caged in a SM enclosure together with 30 sister bees inside a field-foraging colony before being monitored individually in constant laboratory conditions. ‘Colony DM'—same as Colony SM but the enclosure had two meshes that were 1.5 cm apart. The open and filled circles on the perimeter delineate the time of sunrise and sunset, respectively. The blue and red triangles depict the onset and offset for individual bees, respectively. The blue, black and red vectors (arrow) pointing from the centre towards the perimeter show the average time for the onset, median and offset, respectively. Vector length corresponds to the extent of phase coherence. Asterisks in matching colours correspond to the P-value obtained from a Rayleigh test for phase coherence (*0.01<P<0.05, **0.001<P<0.01 and ***P<0.001). The median for each bee (points for individual bees are not shown) was calculated as the midpoint between the onset and offset. Vectors sharing the same colour across different plots, and which are marked with different small letters, are significantly different in a Watson-Williams F-test with Bonferroni post-hoc tests across experimental groups. Sample sizes are 28, 24, 18 and 14 for ‘Colony 48 h', ‘Colony SM', ‘Colony DM' and ‘Lab group 48 h', respectively. (b) Same as in a but each newly emerged bee was caged individually in a SM or DM enclosure in the colony. Repetition with bees from colony H11. Sample sizes are 25, 22, 24 and 16 for ‘Colony 48 h', ‘Isolated SM', ‘Isolated DM' and ‘Lab individually 48 h', respectively.
Figure 5
Figure 5. The colony cycle socially entrains bees experiencing conflicting photic and social time-givers.
(a) Experimental outline. The lower horizontal bar shows the days after introducing newly emerged bees into the observation hive and the illumination regime in the observation hive room: open box, light; filled box, darkness. Starting on day 1, the entrance to the hive was opened only at limited times during the day. During days 3–8, the bees experienced conflicting hive opening/closing and light dark cycles. When the bees were 8 days of age, they were transferred (blue arrow) to individual monitoring cages in constant laboratory conditions and their locomotor activity was monitored for 5 days. (b) Representative circular statistics for bees from colony O12. The nurses and foragers were collected from an observation hive with conflicting light–dark and foraging activity cycles. ‘Nurse-age, lab cage'—a group of 30 newly emerged bees were housed in a cage that was placed next to the observation hive and experienced only the light–dark cycles. The bees from all groups were transferred to locomotor activity monitoring cages at the age of 8 days. Sample sizes are 34, 35 and 24 for ‘Forager', ‘Nurse' and ‘Nurse-age, lab cage', respectively. (c) Representative circular statistics for bees from trial 4 (colony 13–13). The first three treatments are the same as in b. This trial had an additional treatment that consisted of newly emerged bees that were caged in a SM enclosure inside the hive (‘Nurse-age, hive cage'). Sample sizes are 15, 28, 22 and 21 for ‘Forager', ‘Nurse', ‘Nurse-age, hive cage' and ‘Nurse-age, lab cage', respectively. The circle and the circle-backslash symbols point to the times of opening and closing the hive entrance, respectively. Open and filled arrowheads point to the times of lights-on and -off in the chamber in which the observation hive and cage were housed. Asterisks in matching colours correspond to the P-value obtained from a Rayleigh test for phase coherence (***P<0.001). Vectors sharing the same colour across different plots, and which are marked with different small letters, are significantly different in a Watson-Williams F-test with Bonferroni post-hoc tests across experimental groups.

Similar articles

Cited by

References

    1. Espinasa L. & Jeffery W. R. Conservation of retinal circadian rhythms during cavefish eye degeneration. Evol. Dev. 8, 16–22 (2006). - PubMed
    1. Koilraj A. J., Sharma V. K., Marimuthu G. & Chandrashekaran M. K. Presence of circadian rhythms in the locomotor activity of a cave-dwelling millipede Glyphiulus cavernicolus sulu (Cambalidae, Spirostreptida). Chronobiol. Int. 17, 757–765 (2000). - PubMed
    1. Reichle D. E., Palmer J. D. & Park O. Persistent rhythmic locomotor activity in cave cricket hadenoecus subterraneus and its ecological significance. Am. Midl. Nat. 74, 57–66 (1965).
    1. Beaver L. M. et al.. Loss of circadian clock function decreases reproductive fitness in males of Drosophila melanogaster. Proc. Natl Acad. Sci. USA 99, 2134–2139 (2002). - PMC - PubMed
    1. Pittendrigh C. S. Temporal organization—reflections of a Darwinian clock-watcher. Annu. Rev. Physiol. 55, 16–54 (1993). - PubMed

Publication types

LinkOut - more resources