. 2016 Dec;30(12):2312-2321.
doi: 10.1038/leu.2016.142. Epub 2016 May 23.

Eye on the B-ALL: B-cell receptor repertoires reveal persistence of numerous B-lymphoblastic leukemia subclones from diagnosis to relapse

Affiliations

Eye on the B-ALL: B-cell receptor repertoires reveal persistence of numerous B-lymphoblastic leukemia subclones from diagnosis to relapse

R J M Bashford-Rogers et al. Leukemia. 2016 Dec.

Abstract

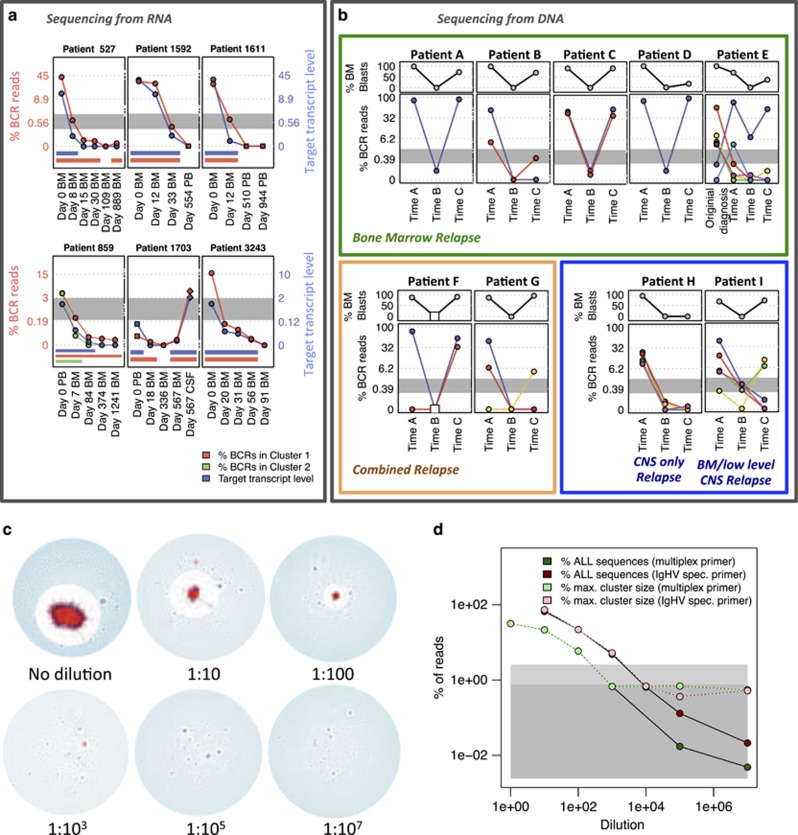
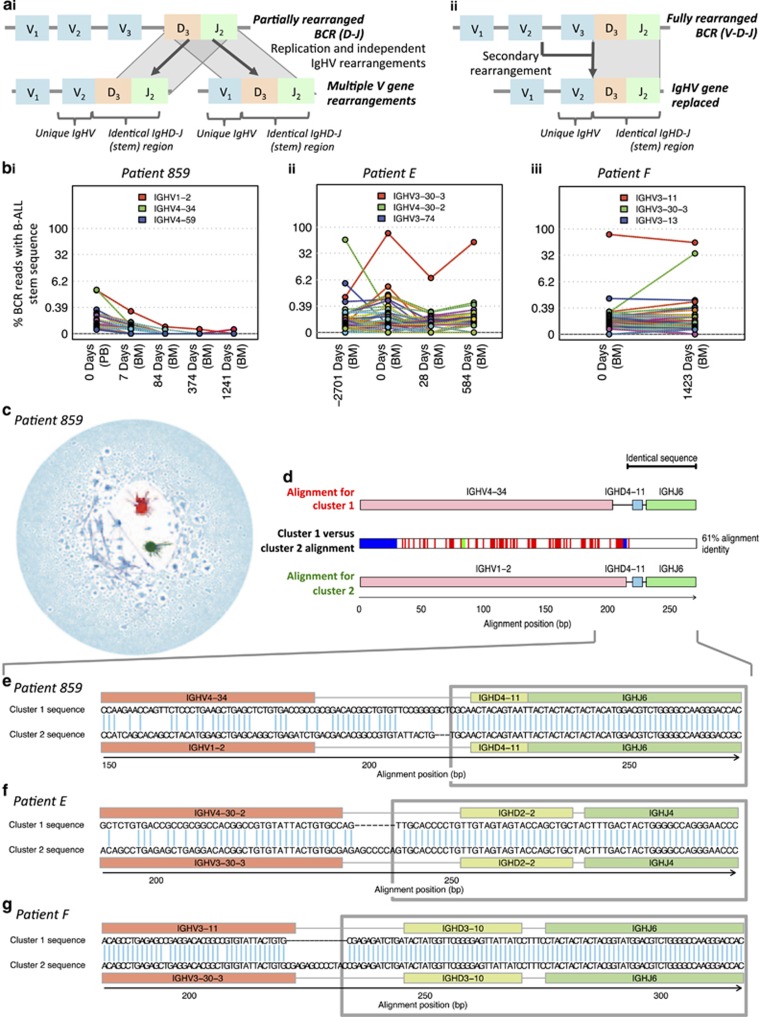
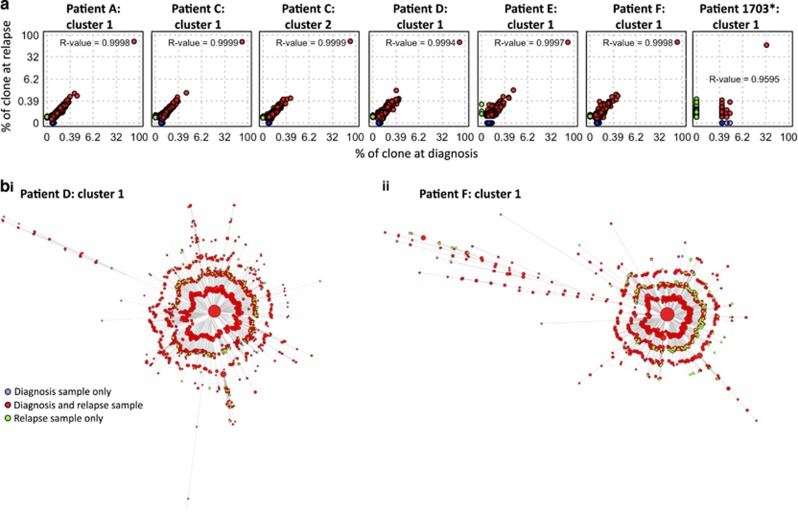
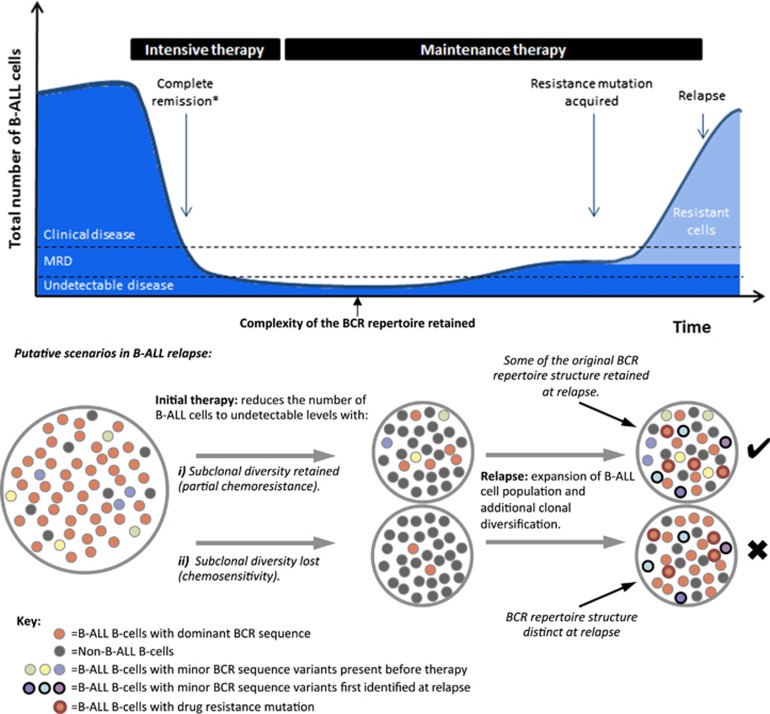
The strongest predictor of relapse in B-cell acute lymphoblastic leukemia (B-ALL) is the level of persistence of tumor cells after initial therapy. The high mutation rate of the B-cell receptor (BCR) locus allows high-resolution tracking of the architecture, evolution and clonal dynamics of B-ALL. Using longitudinal BCR repertoire sequencing, we find that the BCR undergoes an unexpectedly high level of clonal diversification in B-ALL cells through both somatic hypermutation and secondary rearrangements, which can be used for tracking the subclonal composition of the disease and detect minimal residual disease with unprecedented sensitivity. We go on to investigate clonal dynamics of B-ALL using BCR phylogenetic analyses of paired diagnosis-relapse samples and find that large numbers of small leukemic subclones present at diagnosis re-emerge at relapse alongside a dominant clone. Our findings suggest that in all informative relapsed patients, the survival of large numbers of clonogenic cells beyond initial chemotherapy is a surrogate for inherent partial chemoresistance or inadequate therapy, providing an increased opportunity for subsequent emergence of fully resistant clones. These results frame early cytoreduction as an important determinant of long-term outcome.


Figures

Figure 1
Figure 1
BCR sequencing: evaluation of sensitivity and detection of B-ALL clones. (a) qPCR target/control (T/C) transcript ratios (blue) and percentages of RNA-derived clonotypic B-ALL BCR reads over time for each patient (red for largest cluster and green for second largest cluster, where present). The blue axes (right of each plot) refer to the T/C qPCR transcript ratio levels and the red axes (left) to the percentage of sequences in the corresponding clusters (log2 scales). Blue and red bars under each plot indicate time points that are positive for qPCR transcripts and B-ALL BCR reads, respectively. The initial sample for patient 1703 was taken 2 weeks after starting treatment, hence the low levels of qPCR and clonotypic BCR positivity at time 0. BM, bone marrow; PB, peripheral blood; CSF, cerebrospinal fluid sample. (b) Variation of percentages from nine B-ALL patients of BM blasts (top panels) and percentages of DNA-derived clonotypic B-ALL BCR reads over time (bottom panels, different colored lines are used for each individual clone larger than 2.50% of the total BCR repertoire at any of the indicated time points). Percentage of sequences in the corresponding clusters is plotted in a square scale to highlight lower frequency observations. Time points A, B and C refer to diagnosis, day 28 and relapse for each patient, and missing samples are indicated by white squares (patient F, time B). The gray-shaded area shows the maximum cluster sizes for healthy patients (mean±2s.d.). Patients are grouped by clinical relapse type, with BM relapse patients in the green box, combined relapse in the orange box and CNS only/predominant relapse in the blue box. (c, d) RNA from a B-ALL patient sample was mixed with RNA from healthy peripheral blood mononuclear cells (PBMCs) at different ratios. BCR sequencing was performed using the full set of multiplex primers or the single primer with the best alignment to the malignant B-ALL BCR sequence (IgHV-specific primer), each yielding an average of 125 642 filtered BCR sequences (range of 18 970–294 354). (c) Network diagrams showing sequential dilution of B-ALL into healthy blood RNA using the multiplex primers, where clusters within 8 bp sequence similarity to the B-ALL cluster are marked in red and all others in blue. (d) Percentages of BCR sequences corresponding to the B-ALL BCR population at each dilution using multiplex primers (dark-green) and IgHV-specific primer (dark-red). Overlaid is the percentage in the largest BCR cluster (irrespective of relationship to B-ALL) for multiplex primers (light-green) and IgHV-specific primer (light-red).
Figure 2
Figure 2
Secondary IgHV rearrangements in B-ALL subclones. (a) Schematic representation of different mechanisms of secondary IgHV rearrangements. (i) Independent IgHV rearrangements: After the D-J rearrangement, an early B cell divides and the resulting cells undergo independent IgHV rearrangements, while retaining a common IgHD-J stem sequence. (ii) IgHV replacement: an upstream IgHV gene is rearranged onto a pre-existing D-J rearrangement. (b) High-throughput detection of secondary rearrangements in B-ALL patient samples for (i) patient 859, (ii) patient E and (iii) patient F. The percentages of BCR sequences containing the stem sequences from the major clones in each patient were identified in serial time points (encompassing the IgHD-IgHJ region and non-template additions up to 3 bp 3' to the end of the IgHV gene, Supplementary Table S8). Different IgHV gene usages are plotted in different colors, and the highest three observed IgHV genes indicated above the plots. The gray lines indicate the top 99th percentile frequency of each stem sequence in 18 healthy individuals (0% for i–iii). (c) Network diagram for B-ALL patient 859 at day 0, with vertices within the largest cluster (cluster 1) in red, vertices within the second largest cluster (cluster 2) in green and all other vertices in blue. (d) BCR sequence alignment of the dominant sequences from the two dominant clusters in patient 859, cluster 1 and cluster 2 representing 2.81 and 2.89% of BCRs, respectively. The cluster 1 and 2 sequences were aligned to each other, and the positions of differences between sequences are indicated by the colored boxes in the corresponding positions in the middle row, using red for mismatches, green for gaps in cluster 1 BCR and blue for gaps in cluster 2 BCR. The cluster 1 and 2 sequences were 100% identical to the germline genes of (IgHV4-34-IgHD4-11-IgHJ6) and (IgHV1-2-IgHD4-11-IgHJ6), respectively, where the red, blue and green boxes for IgHV, D and J genes mark the gene boundaries respectively. (eg) Alignments of the two largest BCR sequence clusters for patient 859 (e), patient E (f) and patient F (g). The alignments with the reference IgHV (highlighted in red), IgHD (highlighted in yellow) and IgHJ (highlighted in green) genes are indicated with dashes (-) denoting alignment gaps. The regions of the BCR sequence that are identical between the two clusters are highlighted in the gray boxes.
Figure 3
Figure 3
Phylogenetic analysis of paired diagnosis-relapse B-ALL samples. (a) The correlation of B-ALL BCR frequencies between diagnostic and relapse samples (as a percentage of reads in the corresponding clone) observed in (from left to right) DNA samples for patient A cluster 1, patient C cluster 1, patient C cluster 2, patient D cluster 1, patient E cluster 1 and patient F cluster 1 and for patient 1705 cluster 1 (day 0 (combined RNA and DNA sequencing data sets) against relapse (day 567, RNA sequencing data set)). Point colors are blue if the BCR was present only in the diagnostic sample, red if present in both the diagnostic and relapse samples, and green if present only in the relapse sample. Cube-root scales used to highlight the low-frequency BCRs, and presented with the corresponding R2 values. (b) Unrooted maximum parsimony trees showing the relationships between sequences observed in diagnostic and relapse DNA samples for (i) patient D cluster 1 and (ii) patient F cluster 1. Branch lengths are proportional to the number of varying bases (evolutionary distance). Bootstrapping was performed to evaluate the reproducibility of the trees suggesting strong support for the majority of the branches (>70% certainty for branches). Tips represent BCR sequences with point sizes correlating with the proportion of reads for a particular sequence (for display purposes this is not the case for the central cluster, whose size is fixed). The tip colors are blue if the BCR was present only in the diagnostic sample, red if present in both the diagnostic and relapse samples and green if present only in the relapse sample. *The day 0 sample for patient 1703 was taken after chemotherapy had started, hence the depletion of the diagnostic repertoire reflected in the dominance of green tips.
Figure 4
Figure 4
Proposed significance of the overlap between diagnostic and relapse BCR repertoires. Initial intensive therapy reduces the number of B-ALL B cells in a patient to MRD levels and then to undetectable levels before the start of maintenance therapy. During maintenance therapy, the likelihood of acquisition of resistance mutations is proportional to the number of residual clonogenic B-ALL cells. In the depicted example, multiple independent clonogenic cells survive intensive therapy because of relative inherent chemoresistance (or inadequate dosing) and persist throughout maintenance therapy. This increases the likelihood of and leads to the acquisition of a resistance mutation in one of these cells. Nevertheless, B-ALL remains suppressed and undetectable while on maintenance therapy only to relapse after treatment is completed (relapse while on still on treatment is evidently also possible through the same mechanism, but less common). While the main B-ALL clone dominates both the diagnosis and the relapse BCR repertoires, smaller related clones are detected at both these time points providing a surrogate for the inherent chemoresistance of the particular B-ALL or inadequate dosing for the individual patient. *No disease detectable by light microscopy.

References

    1. Pui CH, Robison LL, Look AT. Acute lymphoblastic leukaemia. Lancet 2008; 371: 1030–1043. - PubMed
    1. Fielding AK. The treatment of adults with acute lymphoblastic leukemia. Hematol Am Soc Hematol Educ Program 2008, 381–389, doi:10.1182/asheducation-2008.1.381. - PubMed
    1. Jung D, Giallourakis C, Mostoslavsky R, Alt FW. Mechanism and control of V(D)J recombination at the immunoglobulin heavy chain locus. Annu Rev Immunol 2006; 24: 541–570. - PubMed
    1. Maizels N. Somatic hypermutation: how many mechanisms diversify V region sequences? Cell 1995; 83: 9–12. - PubMed
    1. Kelsoe G. In situ studies of the germinal center reaction. Adv Immunol 1995; 60: 267–288. - PubMed

Publication types

MeSH terms

Substances