. 2016 Apr:6:73-86.
doi: 10.1016/j.ebiom.2016.02.043. Epub 2016 Mar 10.

A Selective Small Molecule DNA2 Inhibitor for Sensitization of Human Cancer Cells to Chemotherapy

Affiliations

A Selective Small Molecule DNA2 Inhibitor for Sensitization of Human Cancer Cells to Chemotherapy

Wenpeng Liu et al. EBioMedicine. 2016 Apr.

Abstract

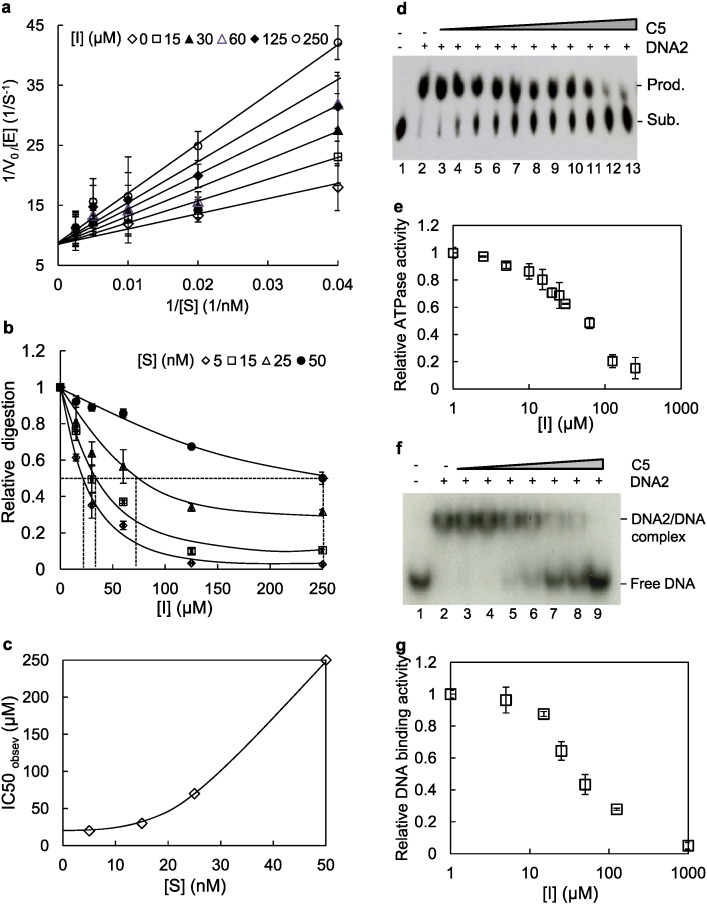
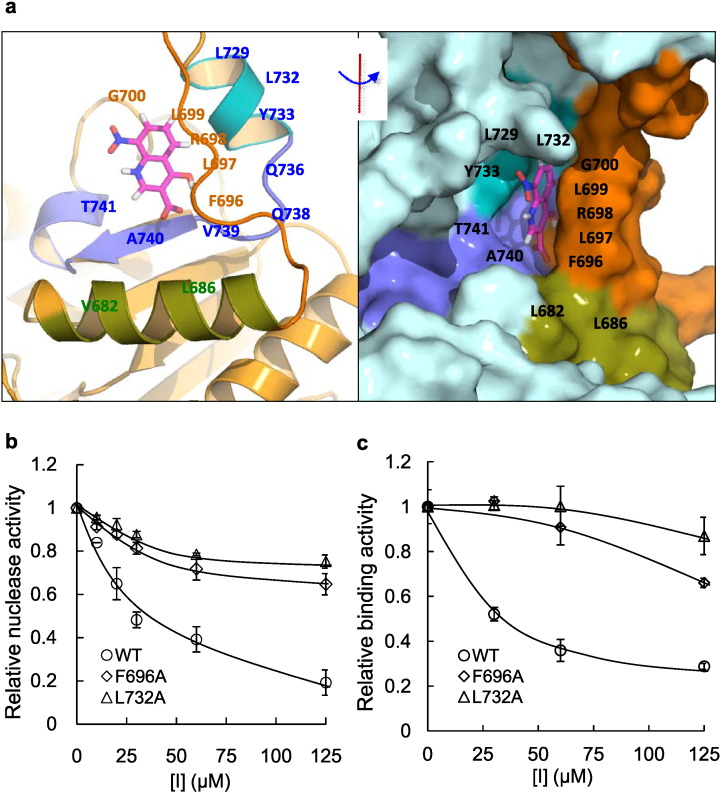
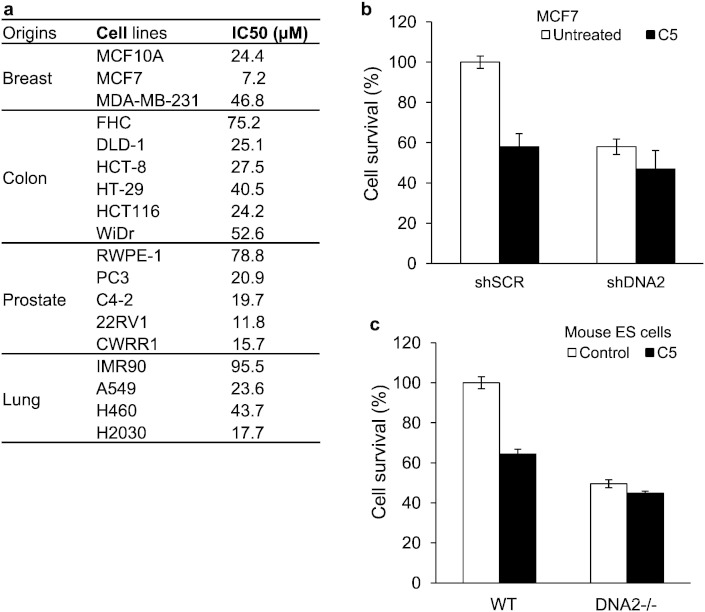
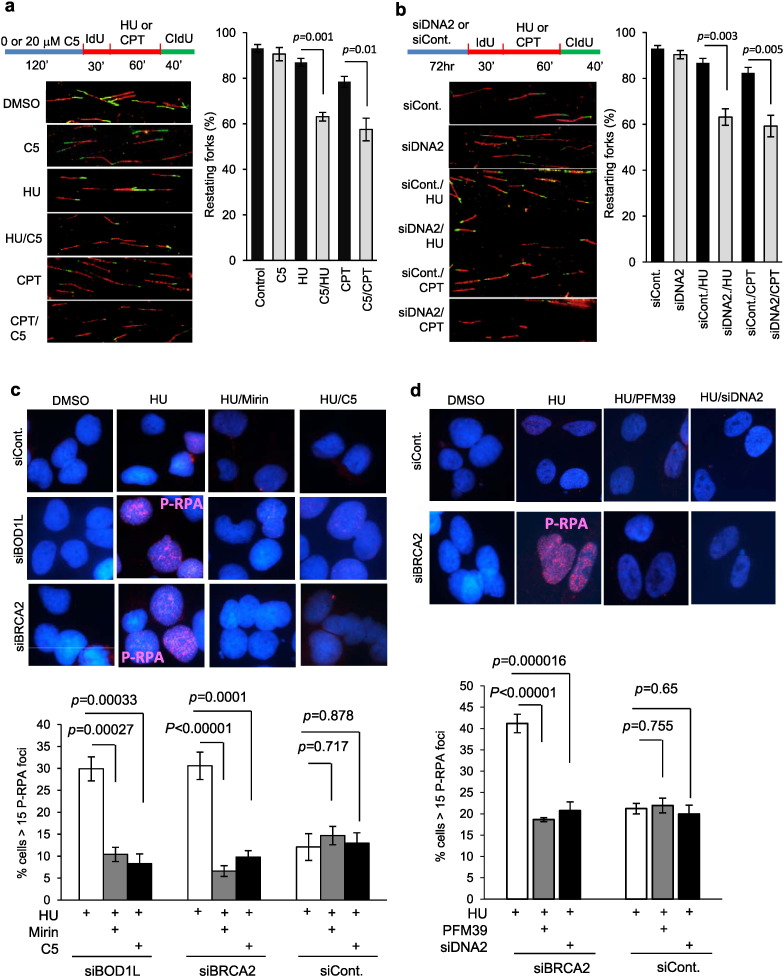
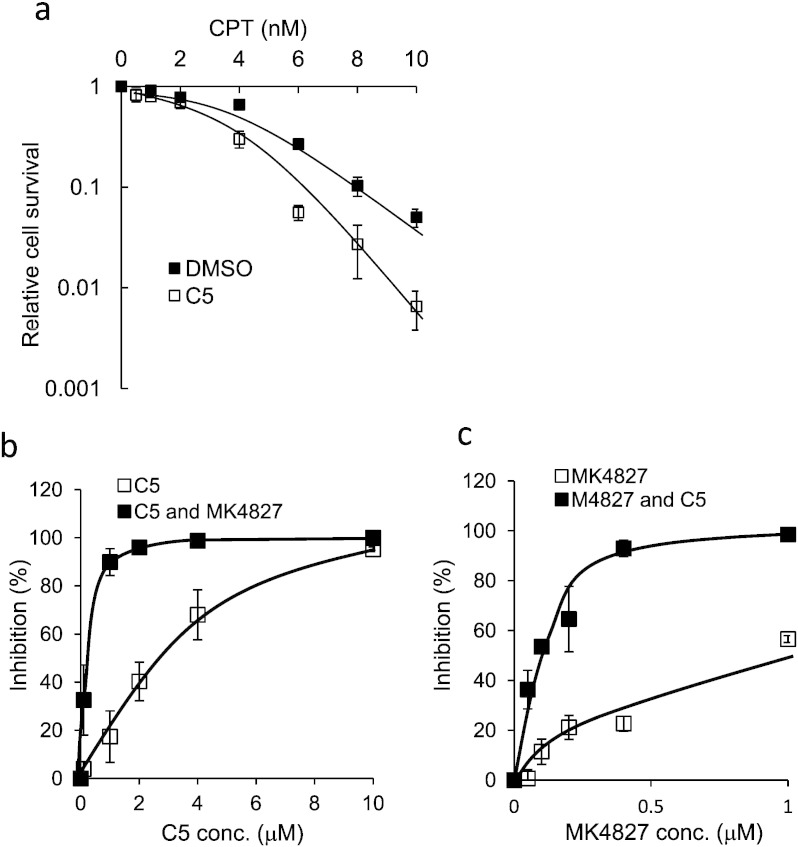
Cancer cells frequently up-regulate DNA replication and repair proteins such as the multifunctional DNA2 nuclease/helicase, counteracting DNA damage due to replication stress and promoting survival. Therefore, we hypothesized that blocking both DNA replication and repair by inhibiting the bifunctional DNA2 could be a potent strategy to sensitize cancer cells to stresses from radiation or chemotherapeutic agents. We show that homozygous deletion of DNA2 sensitizes cells to ionizing radiation and camptothecin (CPT). Using a virtual high throughput screen, we identify 4-hydroxy-8-nitroquinoline-3-carboxylic acid (C5) as an effective and selective inhibitor of DNA2. Mutagenesis and biochemical analysis define the C5 binding pocket at a DNA-binding motif that is shared by the nuclease and helicase activities, consistent with structural studies that suggest that DNA binding to the helicase domain is necessary for nuclease activity. C5 targets the known functions of DNA2 in vivo: C5 inhibits resection at stalled forks as well as reducing recombination. C5 is an even more potent inhibitor of restart of stalled DNA replication forks and over-resection of nascent DNA in cells defective in replication fork protection, including BRCA2 and BOD1L. C5 sensitizes cells to CPT and synergizes with PARP inhibitors.

Keywords: Camptothecin; Cancer; Chemotherapy; DNA binding; DNA end resection; DNA replicatoin fork protection; DNA2 inhibitor; Helicase; Nuclease; PARP inhibitor; Sensitizer.


Figures

Fig 1
Fig 1
Three dimensional human DNA2 model and potential pockets for screening small molecule DNA2 inhibitors (see also Figures S1 and Table S1). a. A homology model for human DNA2 in complex with single-stranded DNA (ssDNA). Orange: ssDNA; Cyan: nuclease domain; Green: ATP binding domain; Pink: helicase domain. Three potential drug binding pockets are specified as Sites 1–3. b. Refinement of the DNA2 model structure by molecular dynamics simulation (50 ns). Root mean square deviation (RMSD) values during simulation at three potential drug binding sites are shown as fluctuating bars. The secondary structures of the sites are represented by color, which is specified at the bottom of the graph. c. The linear domain and motif structures and the drug binding sites of human DNA2. Upper panel: the DNA2 functional domain structure; Middle panel: the three putative drug binding sites; and Bottom panel: the secondary structure motifs. d. Inhibition of DNA2 nuclease activity by chemical compounds that were selected from the virtual screen. Recombinant flag-tagged DNA2 (10 nM) was mixed with 32P-labeled flap DNA substrates (500 fmol) in the absence or presence of the potential DNA2 binding chemical compound (250 μM each). The image shows a representative biochemical reaction (37 °C, 15 min) that was resolved using 15% denaturing polyacrylamide gel electrophoresis (PAGE). The locations of substrates and products on the gel are indicated. e. The chemical name and structure of C5.
Fig. 2
Fig. 2
Inhibitory kinetics of DNA2 nuclease activity, and C5 inhibitory effects to ATPase activity and DNA substrate binding capacity (see also Figure S2). a–c. The nuclease activity of DNA2 was analyzed in the presence of varying concentrations of DNA2 enzyme (0.5–5 nM), flap DNA substrate (5–50 nM), and DNA2 inhibitors C5 (0–250 μM). a. Lineweaver-Burk plot of DNA2 nuclease activity in the presence of various concentrations of flap DNA substrate (x axis) and C5 (μM, designated as [I]). b. DNA2 nuclease activity in the presence of various concentrations of compound C5 (x axis) and flap DNA substrate (nM, designated as [S]). The C5 concentration (IC50observed) that inhibits 50% of the DNA2 nuclease activity at a given concentration of DNA substrates is indicated with dotted lines. The inhibited nuclease activities were normalized to the DMSO control, set as 1. c. Plot of IC50observed versus [S] for determination of IC50. The values of IC50observed obtained from panel B and corresponding DNA substrate concentrations were plotted. When [S] is zero, the derived corresponding IC50observed value is the theoretical IC50 of C5. In panels a–c, the values are means ± s.d of three independent experiments. d. The representative TLC image showing C5 inhibition of the ATPase activity of DNA2. The DNA2 enzyme concentration used was 10 nM; ATP substrate concentration used was 200 μM; DNA concentration used was 200 nM; the inhibitor C5 concentrations used was in a range of 0 to 250 μM. e. Quantification of inhibition of DNA2 in the ATPase activity, the relative ATPase activities normalized to DMSO control. The values shown are the means ± s.d. of three independent assays. f. The representative EMSA image showing C5 inhibition of DNA2 binding to the DNA substrate. The DNA2 enzyme concentration used was 50 nM; the 32P labeled DNA concentration used was 1 nM; the compound C5 concentrations used ranged from 0 to 1000 μM. g. Quantification of inhibition of DNA2 substrate binding, the relative binding activities normalized to DMSO control. The values shown are the means ± s.d. of three independent assays.
Fig. 3
Fig. 3
DNA2 mutations at Site 1 impair C5 inhibition of DNA2 nuclease activity (see also Figure S3). a. Three dimensional structure of the Site 1 small molecule binding pocket of DNA2. The left panel shows a cartoon view and the right panel shows a surface view of Site 1. The C5 inhibitor is shown as a pink stick. The residues 680–691 are green, 692–710 are orange, 729–735 are cyan and 736–745 are light-blue. b. The 14 residues within 6 Å spheres around compound C5 that form Site 1 pocket were identified. Among them, F696A and L732A, which did not affect the nuclease activity of DNA2 (Figure S3), reduced C5 inhibition of DNA2 nuclease activity. The nuclease activity of WT, F696A, and L732A (1 nM) was assayed in the presence of various concentrations of C5 (indicated as [I] in a range from 0 to 250 μM) and quantified, the DNA substrate concentration was 15 nM. We added DMSO without the inhibitor C5 as a control where the relative nuclease activity was set as 1. The values shown are the means ± s.d. of three independent experiments. c. The DNA binding activity of F696A and L732A is resistant to C5 inhibitor. We added DMSO without the inhibitor C5 as a control where the relative binding activity was set as 1. The DNA2 enzyme concentration used was 50 nM. The DNA concentration used was 1 nM. The inhibitor C5 concentrations ranged from 0 to 125 μM. The values shown are the means ± s.d. of three independent experiments.
Fig. 4
Fig. 4
IC50 and on-target cytotoxic effects of C5 in human cancer cells and mouse embryonic stem (MES) cells (see also Figure S4). a. IC50 values of C5 with a panel of 18 cell lines from 4 major types of cancers. Human non-cancerous or cancer cells were seeded on a 96-well plate and incubated in culture medium containing 0 to 80 μM C5 for 7 days. The IC50 was calculated using the CompuSyn software(Chou, 2010). Values are the average of two independent assays. b. Control (shSCR) or DNA2 knockdown MCF7cells were cultured in medium containing 0 or 1 μM C5 for 4 days. The live cells were counted. The cell survival was calculated by normalizing the number of live cells from each culture to that of the control MCF7 cells (shSCR), which was arbitrarily set as 100. c. The same experiment as in A was performed on MES cells from WT and DNA2 knockout mice, which were cultured in medium containing 0 or 1 μM C5 for 4 days. The values shown are the means ± s.d. of three experiments.
Fig. 5
Fig. 5
Inhibitor C5 suppresses resection-related homology directed repair (HDR) and single-stand annealing (SSA) and causes accumulation of phosphorylated RPA foci (see also Figure S5). a. C5 inhibits HDR and SSA frequency. The U2OS cells carrying the GFP reporter gene for HDR or SSA assay were transfected with I-Sce I expression vector. The cells were then incubated in medium containing 0, 10, 20, 40, and 60 μM C5. After 72 h, the cells were harvested and the GFP positive cells were analyzed by flow cytometry. In the DNA2 knockdown experiment, the U2OS cells were transfected with 10 nM of scrambled or DNA2 siRNA oligos for 24 h. The cells were then transfected with the I-SceI expression vector. After 48 h, the cells were harvested and the GFP positive cells were analyzed by flow cytometry. Knockdown of DNA2 in the engineered U2OS cells was confirmed by western blot (Figure S5b). Values are mean ± s.d. of three independent experiments. b. DNA2 inhibition by siRNA or C5 impairs replication fork-related DNA end resection in MCF7 cells at similar levels. MCF7 cells were untreated or treated with 10 μM C5 for 24 h (left panels) or treated with scrambled siRNA (siControl) or siRNA against DNA2 (siDNA2) for 72 h (right panels). The knockdown efficiency of DNA2 was checked by western blotting. The cells were then treated with 1 μM CPT for 4 h. The levels of γ-H2AX and phosphorylated RPA (S33) were analyzed by western blot using antibodies against γH2AX (Millipore) and phosphorylated RPA (S33) (Abcam). Total level of RPA and β-actin were used as controls, which were detected using antibodies against RPA32 (Abcam) and β-actin (GeneTex). c–h. DNA2 inhibition by siRNA or C5 impairs replication fork-related DNA end resection in A549 cells at similar levels. A549 cells were untreated or treated with 10 μM C5 for 24 h (c-e) or treated with scrambled siRNA (siControl) or siRNA against DNA2 (siDNA2) for 48 h (f–h panels). The knockdown efficiency of DNA2 was checked by western blotting (Figure S5). The cells were then treated with 1 μM CPT for 4 h. Panels c and f: Representative images. Panels d, e, g, and h: Quantifications: the levels of γ-H2AX and phosphorylated RPA (S33) were quantified by ImagePro Premier, and the relative P-RPA or γH2AX per nucleus was calculated. Values are means ± s.d. of three independent assays.
Fig. 6
Fig. 6
C5 suppresses restart of stalled DNA replication forks and over-resection of nascent DNA in cells defective in fork protection (see also Figure S6). a. and b. C5 inhibits DNA replication fork restart at similar levels as DNA2 knockdown. a. A549 cells were mock or pretreated with C5 (20 μM) for 2 h, labeled with IdU (red) for 30 min, and co-cultured with IdU and the indicated drugs (20 μM C5, 150 nM CPT or 2 mM HU) or drug combinations (20 μM C5 combined with 150 nM CPT or 2 mM HU) for 1 h, and then washed and labeled with CIdU (green) for 40 min. Percentage of restarting forks (red-green tracks) was calculated by dividing the red-green tracks by the sum of the red-green and red only tracks. At least 150 tracks counted for each sample as shown in left panels were calculated. Values are means ± s.d. from three independent experiments (right panel). The p value was calculated by the Student's t-test. b. For the control experiment in which knockdown of DNA2 was employed, A549 cells were transfected with scrambled or DNA2 siRNAs for 72 h, and the ability of the cells to restart replication after CPT or HU fork stalling was determined as in panel a. Western blotting confirmed an efficient knockdown of DNA2 at 72 h post siRNA transfections (Figure S5). In both panels a and b, red tracks represent synthesis before addition of HU or CPT. Red/green tracks represent molecules that recovered from fork stalling. Green only tracks represent initiations after removal of HU or CPT. c–d. C5 prevents single-stranded DNA accumulation in BOD1L-depleted or BRCA2-depleted U2OS cells upon replication stalling with HU at similar level as DNA2 knockdown. c. Cells with more than 15 P-RPA foci indicative of single-stranded DNA were scored in U2OS cells transfected with siRNA against BRCA2 or BOD1L or scrambled siRNA, as indicated, followed by treatment with 4 mM hydroxyurea (HU) for 5 h. Cells were pretreated with MRE11 inhibitor mirin (50 μM) or DNA2 inhibitor C5 (20 μM). In the absence of HU, no cells with greater than 15 foci were observed. d. Cells with more than 15 P-RPA foci indicative of single-stranded DNA were scored in U2OS cells transfected with siRNA against BRCA2 or scrambled siRNA, as indicated, followed by treatment with 4 mM HU for 5 h. Cells were pretreated with MRE11 inhibitor, PFM39 or siRNA against DNA2. In both c and d, top panels show the representative immunofluorescence images, and the bottom panel shows the quantifications. Error bars represent the SEM. p-Values were calculated with the Student's t-test. Western blots of knockdowns are shown in Figure S6.
Fig. 7
Fig. 7
DNA2 inhibitor C5 synergistically kills breast cancer cells MCF7 with CPT and PARP inhibitor MK4827. a. C5 sensitizes MCF cells to CPT. Clonogenic assays were conducted to evaluate the survival rate of MCF cells treated with different concentrations of CPT in the absence or presence of C5 (1 μM). The survival rate of the cells treated with various concentrations of CPT was calculated by normalizing the number of colonies to that of the cells without CPT treatment. The survival rate of the cells without CPT treatment was arbitrarily set as 1. The values shown are the means ± s. d. of three independent experiments. b–c. The synergy between the DNA2 inhibitor C5 and the PARP inhibitor MK4827 was assayed by clonogenic assay. The values are means ± s.d. of three independent clonogenic assays. The IC50 and combination index (CI) was calculated using the Compusyn program. b. Representative inhibition curve of varying concentrations of C5 from 0 to 10 μM in combination with MK4827 (0 or 1 μM). c. Representative inhibition curve of varying concentrations of MK4827 from 0 to 1 μM in combination with C5 (0 or 2 μM).

References

    1. Bae S.H., Bae K.-H., Kim J.A., Seo Y.S. RPA governs endonuclease switching during processing of Okazaki fragments in eukaryotes. Nature. 2001;412:456–461. - PubMed
    1. Bae S.-H., Kim D.W., Kim J., Kim J.-H., Kim D.-H., Kim H.-D., Kang H.-Y., Seo Y.-S. Coupling of DNA helicase and endonuclease activities of yeast Dna2 facilitates Okazaki fragment processing. J. Biol. Chem. 2002;277:26632–26641. - PubMed
    1. Balakrishnan L., Polaczek P., Pokharel S., Campbell J.L., Bambara R.A. Dna2 exhibits a unique strand end-dependent helicase function. J. Biol. Chem. 2010;285:38861–38868. - PMC - PubMed
    1. Begg A.C., Stewart F.A., Vens C. Strategies to improve radiotherapy with targeted drugs. Nat. Rev. Cancer. 2011;11:239–253. - PubMed
    1. Bryant H.E., Petermann E., Schultz N., Jemth A.S., Loseva O., Issaeva N., Johansson F., Fernandez S., Mcglynn P., Helleday T. PARP is activated at stalled forks to mediate Mre11-dependent replication restart and recombination. EMBO J. 2009;28:2601–2615. - PMC - PubMed

MeSH terms