. 2016 Apr:6:149-161.
doi: 10.1016/j.ebiom.2016.03.030. Epub 2016 Mar 25.

Weight Loss Upregulates the Small GTPase DIRAS3 in Human White Adipose Progenitor Cells, Which Negatively Regulates Adipogenesis and Activates Autophagy via Akt-mTOR Inhibition

Affiliations

Weight Loss Upregulates the Small GTPase DIRAS3 in Human White Adipose Progenitor Cells, Which Negatively Regulates Adipogenesis and Activates Autophagy via Akt-mTOR Inhibition

Asim Ejaz et al. EBioMedicine. 2016 Apr.

Abstract

Long-term weight-loss (WL) interventions reduce insulin serum levels, protect from obesity, and postpone age-associated diseases. The impact of long-term WL on adipose-derived stromal/progenitor cells (ASCs) is unknown. We identified DIRAS3 and IGF-1 as long-term WL target genes up-regulated in ASCs in subcutaneous white adipose tissue of formerly obese donors (WLDs). We show that DIRAS3 negatively regulates Akt, mTOR and ERK1/2 signaling in ASCs undergoing adipogenesis and acts as a negative regulator of this pathway and an activator of autophagy. Studying the IGF-1-DIRAS3 interaction in ASCs of WLDs, we demonstrate that IGF-1, although strongly up-regulated in these cells, hardly activates Akt, while ERK1/2 and S6K1 phosphorylation is activated by IGF-1. Overexpression of DIRAS3 in WLD ASCs completely inhibits Akt phosphorylation also in the presence of IGF-1. Phosphorylation of ERK1/2 and S6K1 is lesser reduced under these conditions. In conclusion, our key findings are that DIRAS3 down-regulates Akt-mTOR signaling in ASCs of WLDs. Moreover, DIRAS3 inhibits adipogenesis and activates autophagy in these cells.

Keywords: Adipogenesis; Aging; Akt; Autophagy; Caloric restriction; DIRAS3; ERK1/2; Human adipose-derived stromal/progenitor cells; IGF-1; Insulin; Obesity; Weight loss; mTOR.


Figures

Image 1
Graphical abstract
Fig. 1
Fig. 1
DIRAS3 expression is up-regulated upon long-term WL in human ASCs. (A) DIRAS3 expression relative to actin was analyzed by q-RT-PCR in early passage ASCs derived from WLDs (n = 4), NWDs (n = 3) and ODs (n = 3). (B) (left panel) Tissue lysates from different donors were examined for DIRAS3 expression by Western blotting. U-2OS cells overexpressing DIRAS3 served as input control (OV). Equal protein quantities were loaded on SDS PAGE based on BCA quantification. Staining of total protein served as control for equal loading. (Right panel) Densitometric band intensities of the DIRAS3 Western blot were quantified using ImageJ. (C) ASCs were cultured for 48 h in 10% FCS or in the absence of serum (Wo FCS) and relative expression of DIRAS3 mRNA was quantified by q-RT-PCR normalized to actin. (D) Detection of DIRAS3 protein in lysates from ASCs cultured in medium supplemented with 2.5% FCS and for four days without serum (starvation) by Western blotting. ASCs infected with a DIRAS3 overexpressing lentivirus (DIRAS3 OV) served as control. All error bars represent the means ± SEM. p values * = p < 0.05, ** = p < 0.001 and *** = p < .0001. The significance of difference between means was assessed by analysis of variance (ANOVA) (A and B) and Student's t test (C).
Fig. 2
Fig. 2
Impact of DIRAS3 knock-down (KD) and over-expression (OV) on Akt–mTOR pathway in human ASCs. (A) Efficiency of RNA interference mediated DIRAS3 KD in ASCs was analyzed at mRNA level using q-RT-PCR employing actin as reference gene. (B) DIRAS3 KD efficacy at protein level was evaluated by Western blotting. DIRAS3 was overexpressed in the experimental cell line U-2OS, followed by KD using specific shRNA expressing lentiviruses. (C) DIRAS3 was KD in ASCs using specific shRNA, and cells were density arrested and starved by serum withdrawal for 48 h. Then a cocktail containing 2.5% FCS, insulin, 3-isobutyl-1-methylxanthine, and dexamethasone was added. Cell lysates were harvested at indicated time points. Phosphorylation of Akt (S473), S6K1 (T389) and 4EBP1 (T37/46) was examined by Western blotting. (D–F) Fold changes in densitometric band intensities, acquired by ImageJ were compared. Band intensity of shCntrl at time point 0 min was taken as 1. (G) Overexpression of DIRAS3 mRNA normalized to actin and (H) protein in ASCs infected with lentiviruses expressing DIRAS3 under control of CMV promoter. (I) Following DIRAS3 over-expression, cells were density arrested and starved by serum withdrawal for 48 h. Then a cocktail containing 2.5% FCS, insulin, 3-isobutyl-1-methylxanthine, and dexamethasone was added. Cell lysates were harvested at indicated time points. Phosphorylation of Akt (S473), S6K1 (T389) and 4EBP1 (T37/46) was examined by Western blotting from cell lysates harvested at indicated time points. (J–L) Fold changes in densitometric band intensities, acquired by ImageJ were compared. Band intensity of Mock control at time point 0 min was taken as 1. All error bars represent the means ± SEM. p values * = p < 0.05, ** = p < 0.001 and *** = p < .0001. The significance of difference between means was assessed by analysis of variance (ANOVA) (D, E, F, J, K and L).
Fig. 3
Fig. 3
DIRAS3 is a negative regulator of adipogenesis in human ASCs. (A) DIRAS3 mRNA expression normalized to actin was investigated by q-RT-PCR during the course of adipogenesis (n = 6). (B) Akt–mTOR pathway activity pattern was monitored during the first 72 h of adipogenesis upon DIRAS3 KD. Phosphorylation of Akt (S473) and S6K1 (T389) was examined by Western blotting. (C) ASCs infected with either shCntrl or shDIRAS3 expressing lentiviruses were subjected to adipogenesis and mRNA expression of adipocyte marker genes FABP4, Perilipin and Adiponectin normalized to actin were analyzed using q-RT-PCR at the indicated time points. (D) Perilipin protein expression was analyzed by western blotting at day 9 post-adipogenesis induction in shCntrl and shDIRAS3 ASCs. (E) Adipocyte differentiation was estimated using Oil-Red-O staining at day 9 post-induction. (F and G) Representative immunohistochemical staining of xenotransplanted shDIRAS3 SCID mice (F) and shCntrl mice (G) using anti-perilipin antibodies. Region of Interest (ROI) is shown in higher magnification. (H) Margin of the transplant from each mice was imaged at 20 × magnification and perilipin positive and negative cells were counted using ImageJ cell counter plugin and shown as percentage positive cells (n = 6). (I–K) ASCs infected with either Mock or DIRAS3 overexpressing lentiviruses were subjected to adipogenesis and mRNA expression of adipocyte marker genes normalized to actin was analyzed using q-RT-PCR at the indicated time points (I). Perilipin protein analysis (J) and Oil-Red-O staining (K) were done at day 9 post-induction of adipogenesis. All error bars represent the means ± SEM. p values * = p < 0.05, ** = p < 0.001 and *** = p < .0001. The significance of difference between means was assessed by analysis of variance (ANOVA) (A, C and I) and Student's t test (H).
Fig. 4
Fig. 4
DIRAS3 knock-down mediated enhancement of adipogenesis is orchestrated by up-regulation of C/EBP-β and PPAR-γ2. (A) Relative expression of CEBP-β, PPAR-γ2 and CEBP-α was analyzed normalized to actin at different time points during adipogenesis by RT-PCR. (B) CEBP-β protein level during 72 h after adipogenesis induction. For optimal separation of bands, C/EBP-β Full-LAP and C/EBP-β LAP were analyzed using a 8% PAGE (upper panel) and C/EBP-β LIP using a 12,5% PAGE (lower panel). (C and D) Phosphorylation of ERK1/2 (T282/Y204) (C) and Foxo-1(S256) (D) was monitored by Western blotting during 72 h of adipogenesis. (E) Localization of Foxo-1 within the cells upon DIRAS3 KD was visualized by IF-CLSM. Foxo-1 (green), TO-PRO3 for nuclear staining (red), Merge (white, obtained by using a co-localization mask). Co-localization mask was obtained by plotting gray scale pixels in x–y axis scatter plot, where x-axis represents green channel (Foxo1) and y-axis represents red channel (TO-PRO3). Double positive pixels are represented in co-localization mask as white. Laser Sharp 2000 software from Zeiss was employed for the image analyses. All error bars represent the means ± SEM. p values * = p < 0.05, ** = p < 0.001 and *** = p < .0001. The significance of difference between means was assessed by analysis of variance (ANOVA) (A).
Fig. 5
Fig. 5
WL-induced overexpression of DIRAS3 increases autophagy. (A and B) DIRAS3 was KD (A) or overexpressed (B) in ASCs. (Left panels) Conversion of LC3I to LC3II was monitored by Western blotting at different time points after induction of adipogenesis. (Right panels) Densitometric band intensities were quantified using ImageJ. (C) Autophagy flux was evaluated in DIRAS3 KD and DIRAS3OV ASCs by starving these cells for 3 h with HBSS in the presence of 400 nM bafilomycin A1. Conversion of LC3I to LC3II was monitored by Western blotting. (D) Western blot analysis of ATG4b expression upon DIRAS3 KD (left panel). Band intensities were quantified using ImageJ (right panel). (E and F) ASCs were co-infected with GFP-LC3 and either shDIRAS3 (E) or DIRAS3 overexpressing lentiviruses (F). Cells were starved for 3 h and LC3 punctate formation was visualized by IF-CLSM. 400 × magnification. (G–H) ASCs were co-infected with GFP-LC3 and shControl or shDIRAS3 lentiviruses. Cells were analyzed by image stream multispectral flow cytometer. (G) Serum starved cells were taken as a positive control for autophagy induction and a fold change in autophagy high cells was calculated taking the number of autophagy high cells in the presence of serum as 1. (H) Number of autophagy high cells in shcontrol settings was taken as 1 and a fold change was calculated upon DIRAS3 KD. (I and J) Lysosomal acidity was monitored as a read-out of autophagy in ASCs upon DIRAS3 KD (J) or DIRAS3 OV (K) using Lyso-tracker red dye. (K) WAT lysates from WLDs, NWDs and ODs were analyzed by Western blotting to evaluate LC3I conversion to LC3II (upper panel). Densitometric band intensities were quantified using ImageJ (lower panel). (L) Conversion of LC3I to LC3II was monitored by Western blotting during adipogenesis in DIRAS3 KD and control ASCs. All error bars represent the means ± SEM. p values * = p < 0.05, ** = p < 0.001 and *** = p < .0001. The significance of difference between means was assessed by analysis of variance (ANOVA) (A, B, D and K) and Student's t test (H, I and J).
Fig. 6
Fig. 6
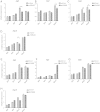
Long-term WL induces IGF-1 expression in human ASCs. IGF-1 is up-regulated during adipogenesis and IGF-1-induced Akt–mTOR activation is counteracted by DIRAS3. (A) IGF-1 expression was studied by q-RT-PCR in ASCs derived from WLDs (n = 4), NWDs (n = 3) and ODs (n = 3) normalized to actin. (B) IGF-1 expression was analyzed upon serum starvation of ASCs in reference to actin gene. (C) IGF-1 concentration in supernatant (SN) of ASCs derived from sWAT of WLDs after 3 days of cultivation in basal medium (containing 10% FCS) relative to basal medium (containing 10% FCS) was determined by human IGF-1 ELISA kit (Ref: E20, Lot: 120115, Mediagnost, Germany). (D) IGF-1 expression was investigated in the course of adipogenesis using q-RT-PCR normalized to actin. (E) IGF-1-R expression was analyzed upon serum starvation of ASCs using actin as reference gene. (F) IGF-1R expression normalized to actin was investigated in the course of adipogenesis using q-RT-PCR. (G) DIRAS3 expression in ASCs at 6 h after addition of IGF-1 was quantified by q-RT PCR employing actin as reference gene. (H) ASCs were infected with mock or DIRAS3 overexpression lentiviruses. Cells were starved for 48 h followed by addition of increasing concentrations of IGF-1 for 10 min. Phosphorylation of Akt (S473), S6K1 (T389) and ERK1/2 (T282/Y204) was examined by Western blotting. All error bars represent the means ± SEM. p values * = p < 0.05, ** = p < 0.001 and *** = p < .0001 (number of donors = 3). The significance of difference between means was assessed by analysis of variance (ANOVA) (A, D and G) and Student's t test (B, C and E).
Supplementary Fig. 1.
Supplementary Fig. 1
Akt (S473), P70S6K (T389), ERK1/2 (T282/Y204) phosphorylation and LC3I to LC3II conversion pattern during the course of adipogenesis. ASCs were grown to confluence and starved for 48 h. Adipogenesis was induced using hormone cocktail. Cell lysates were collected at indicated time points and blotted for phosphorylated and total Akt, P70S6K, ERK1/2 and LC3.
Supplementary Fig. 2.
Supplementary Fig. 2
Knock-down (KD) of DIRAS3 results in up-regulation of PI3K pathway. (A) DIRAS3 was KD in human ASCs using specific shRNA, cells were density arrested and starved by serum withdrawal for 48 h and then tyrosine kinase receptor signaling was induced by a cocktail containing 2.5% FCS, insulin, 3-isobutyl-l-methylxanthine, and dexamethasone. Cell lysates were harvested at indicated time points. Phosphorylation of Akt (S473), P70S6K (T389) and 4EBP1 (T37/46) was examined by Western blotting using specific antibodies. (B–D) Fold changes in densitometric band intensities, acquired by ImageJ were compared. Band intensity of shCntrl at time point 0 min was taken as 1. All error bars represent the means ± SEM. p values * = p < 0.05, ** = p < 0.001 and *** = p < .0001. The significance of difference between means was assessed by analysis of variance (ANOVA) (B, C, and D).
Supplementary Fig. 3.
Supplementary Fig. 3
Morphological transformation of human ASCs during adipogenesis. ASCs were grown to confluence and starved for 48 h. Adipogenesis was induced using hormone cocktail. Morphology of cells was documented using bright-field microscopy. Cells were stained with Oil-Red-O to stain the lipid droplets at day 9 post-induction.
Supplementary Fig. 4.
Supplementary Fig. 4
(A) Up-regulation of DIRAS3 in the course of adipogenesis depends on the adipogenic program. ASCs were grown to confluence and starved for 48 h. DIRAS3 mRNA expression was analyzed by qRT-PCR 24 h after induction either with complete hormone cocktail—DMI (DMEM-F12 HAM medium + 2.5% FCS + Dex + IBMX + insulin), or ASC1 (DMEM-F12 HAM medium without FCS) or ASC2 (DMEM-F12 HAM medium + 10% FCS) or PM4 (DMEM-F12 HAM medium + 2.5% FCS + EGF + FGF + Insulin) or specific ingredients separately as indicated. (B and C) mRNA expression was investigated in the course of adipogenesis employing q-RT-PCR for DIRAS2 (B, n = 2) and DIRAS1 (C, n = 2).
Supplementary Fig. 5.
Supplementary Fig. 5
ERK and Akt inhibition blocks DIRAS3 knock-down mediated up-regulation of adipogenesis in human ASCs. (A and B) DIRAS3 was KD in ASCs using specific shRNA expressing lentiviruses. Cells were subjected to adipogenesis in the presence or absence of AktVIII (Akt inhibitor), rapamycin (mTOR inhibitor) and U0126 (ERK inhibitor). Adipogenesis was monitored by measuring expression of FABP4 (A) and Perilipin (B) by qRT-PCR 72 h post-induction.
Supplementary Fig. 6.
Supplementary Fig. 6
Expression of autophagy related genes during adipogenesis in human ASCs and after knockdown or overexpression of DIRAS3. (A–D) Expression of Atg5 (A), Atg7 (B), Atg8 (C) and Atg16 (D) was analyzed by q-RT-PCR during adipogenesis, comparing shCntrl and shDIRAS3 expressing lentiviruses infected ASCs. (E–H) Q-RT-PCR was employed to monitor the expression of Atg5 (E), Atg7 (F), Atg8 (G) and Atg16 (H) during adipogenesis, comparing Mock and DIRAS3 over-expressing lentiviruses infected ASCs. All genes were normalized to actin. (I) ASCs were co-infected with GFP-LC3 lentiviruses. Serum starved cells were taken as a positive control for autophagy induction and non-serum starved cells were used as negative control. Cells were analyzed by image stream multispectral flow cytometer. Representative low autophagic (upper panel) and high autophagic cells (lower panel) are shown. (J) ASCs were co-infected with GFP-LC3 and shControl (shCntrl) or shDIRAS3 lentiviruses. Cells were analyzed by image stream multispectral flow cytometer. (J) Representative shCntrl (upper panel) and shDIRAS3 (lower panel) cells are shown. All error bars represent the means ± SEM. p values * = p < 0.05, ** = p < 0.001 and *** = p < .0001. The significance of difference between means was assessed by analysis of variance (ANOVA) (A–H).

Similar articles

Cited by

References

    1. Bäck K., Arnqvist H.J. Changes in insulin and IGF-I receptor expression during differentiation of human preadipocytes. Growth Hormon. IGF Res. 2009;19:101–111. - PubMed
    1. Baerga R., Zhang Y., Chen P.H., Goldman S., Jin S. Targeted deletion of autophagy-related 5 (atg5) impairs adipogenesis in a cellular model and in mice. Autophagy. 2009;5:1118–1130. - PMC - PubMed
    1. Bartke A., Sun L.Y., Longo V. Somatotropic signaling: trade-offs between growth, reproductive development, and longevity. Physiol. Rev. 2013;93:571–598. - PMC - PubMed
    1. Berry D.C., Stenesen D., Zeve D., Graff J.M. The developmental origins of adipose tissue. Development. 2013;140:3939–3949. - PMC - PubMed
    1. Blüher M., Michael M.D., Peroni O.D., Ueki K., Carter N., Kahn B.B., Kahn C.R. Adipose tissue selective insulin receptor knockout protects against obesity and obesity-related glucose intolerance. Dev. Cell. 2002;3:25–38. - PubMed

MeSH terms