

Global trends and patterns of commercial milk-based formula sales: is an unprecedented infant and young child feeding transition underway?
- PMID: 27211798
- PMCID: PMC10270963
- DOI: 10.1017/S1368980016001117
Global trends and patterns of commercial milk-based formula sales: is an unprecedented infant and young child feeding transition underway?
Abstract
Objective: The marketing of infant/child milk-based formulas (MF) contributes to suboptimal breast-feeding and adversely affects child and maternal health outcomes globally. However, little is known about recent changes in MF markets. The present study describes contemporary trends and patterns of MF sales at the global, regional and country levels.
Design: Descriptive statistics of trends and patterns in MF sales volume per infant/child for the years 2008-2013 and projections to 2018, using industry-sourced data.
Setting: Eighty countries categorized by country income bracket, for developing countries by region, and in countries with the largest infant/child populations.
Subjects: MF categories included total (for ages 0-36 months), infant (0-6 months), follow-up (7-12 months), toddler (13-36 months) and special (0-6 months).
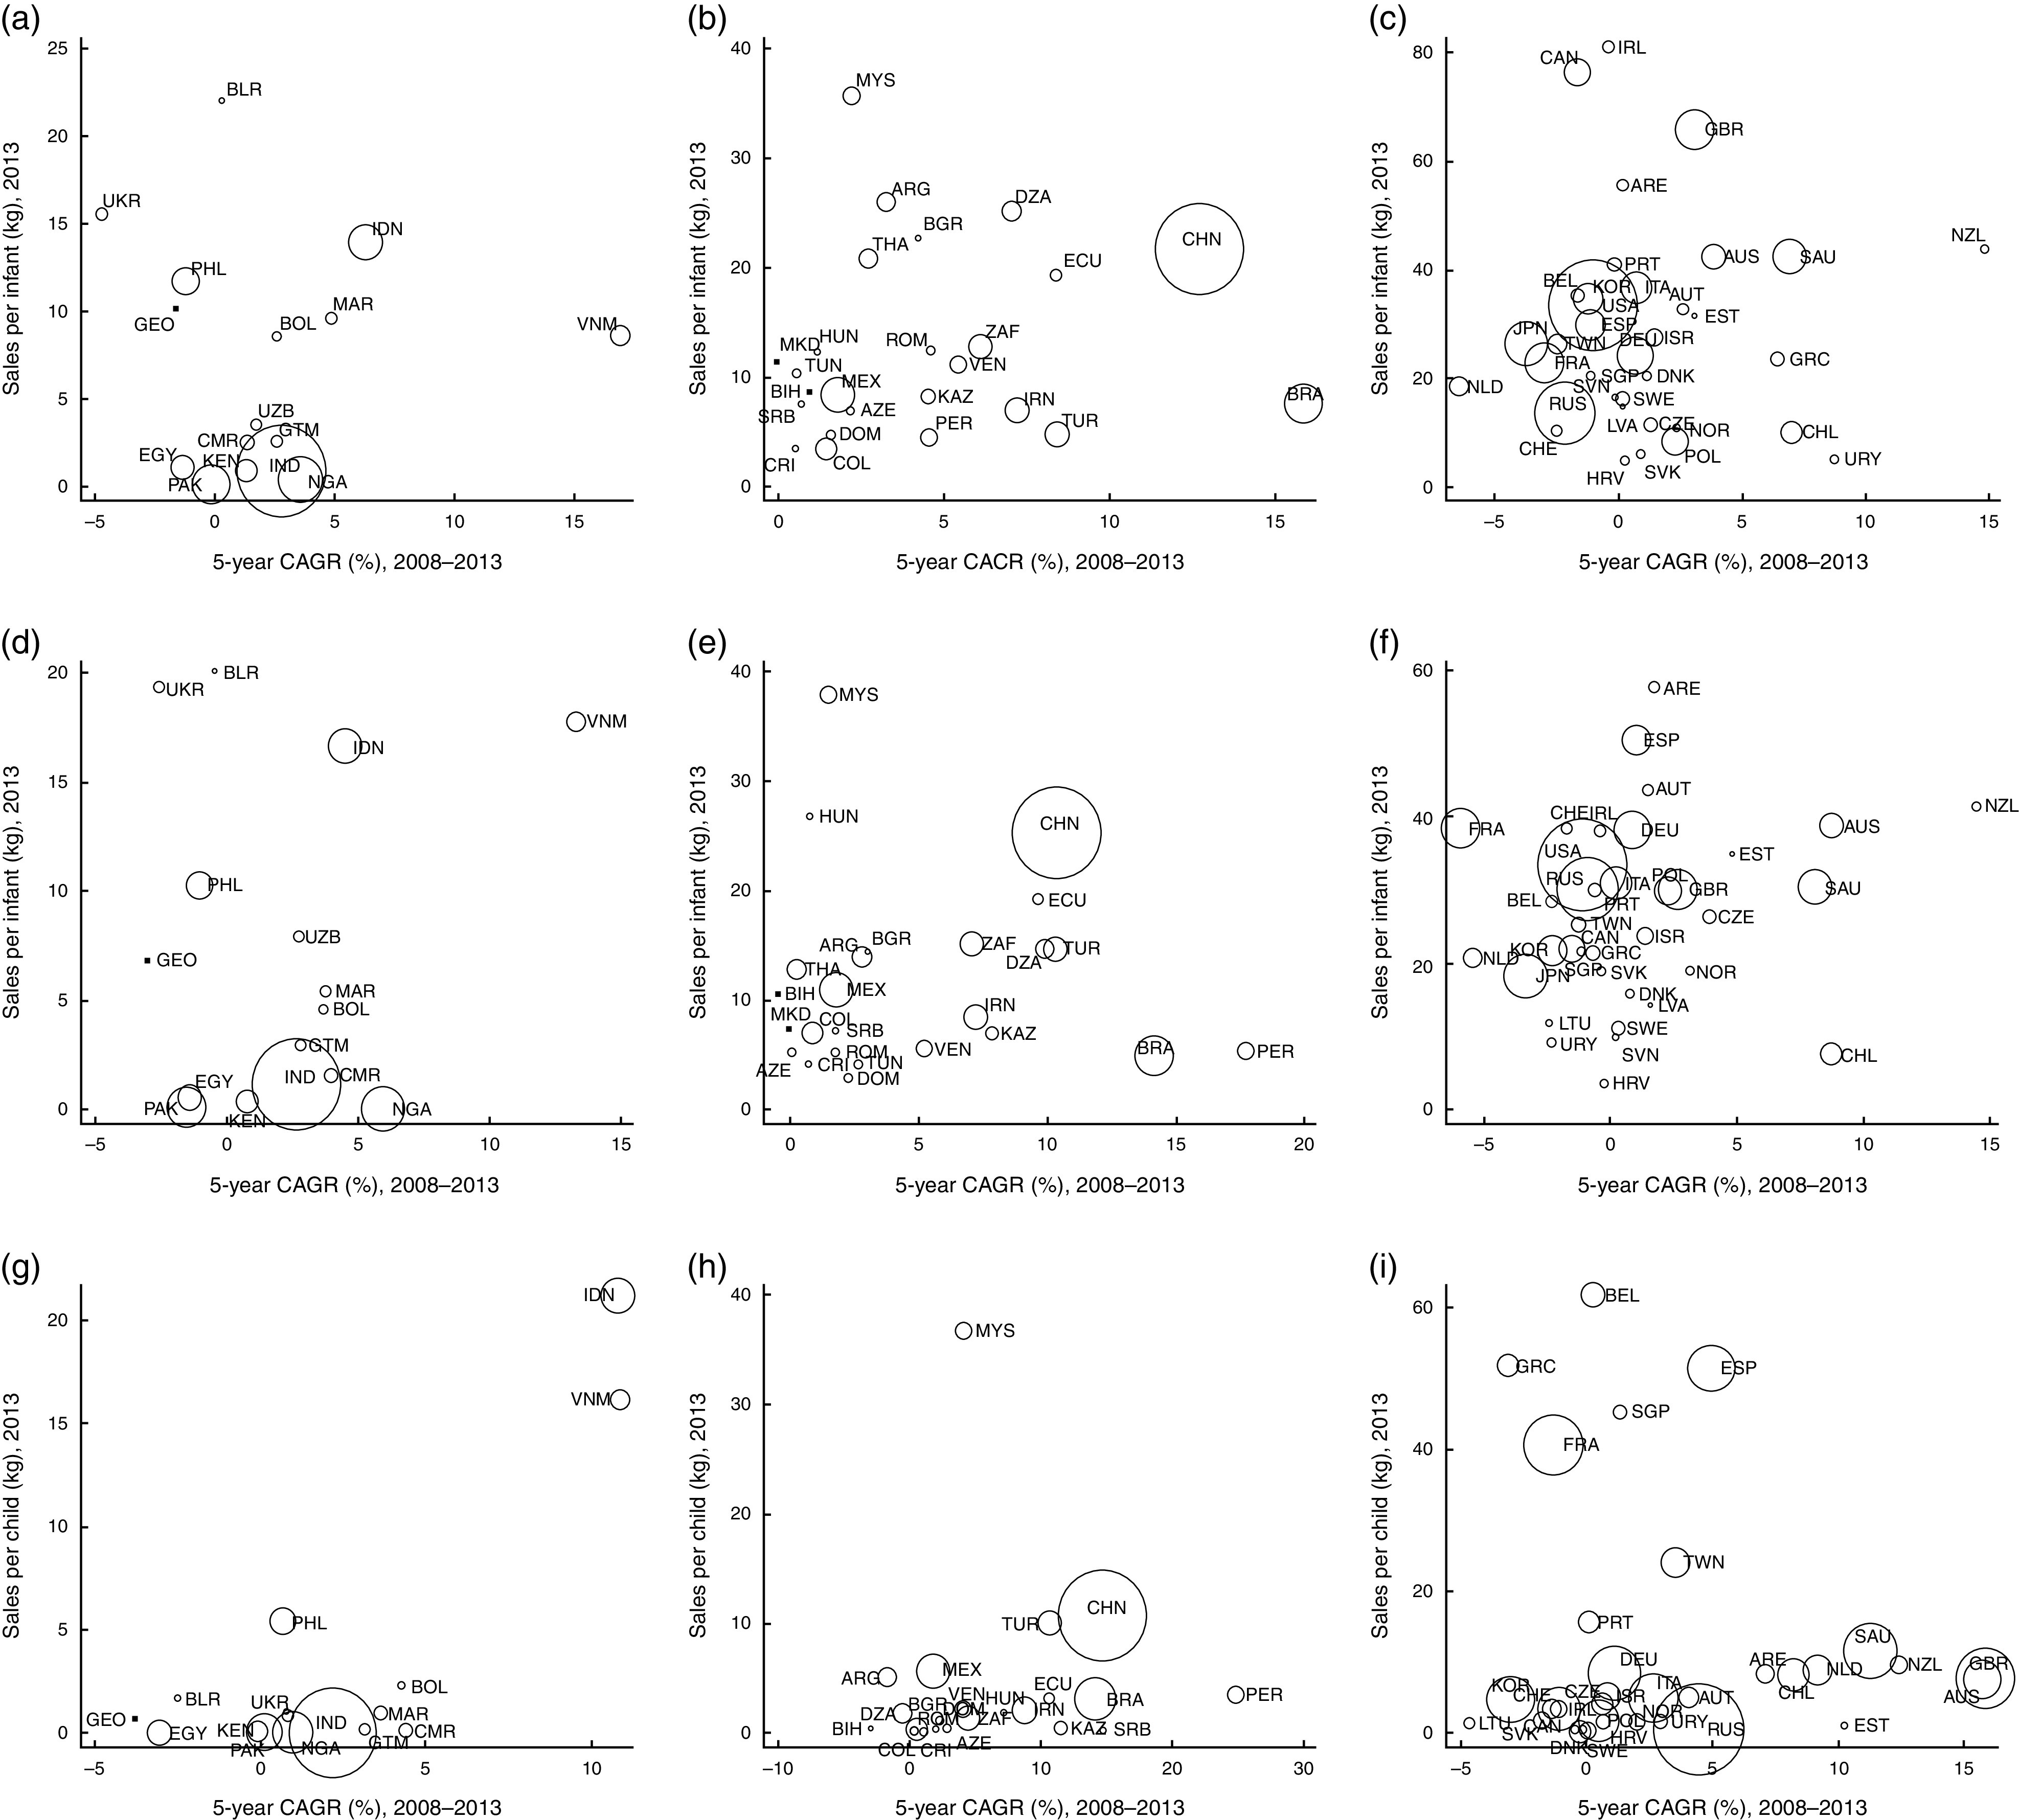
Results: In 2008-2013 world total MF sales grew by 40·8 % from 5·5 to 7·8 kg per infant/child/year, a figure predicted to increase to 10·8 kg by 2018. Growth was most rapid in East Asia particularly in China, Indonesia, Thailand and Vietnam and was led by the infant and follow-up formula categories. Sales volume per infant/child was positively associated with country income level although with wide variability between countries.
Conclusions: A global infant and young child feeding (IYCF) transition towards diets higher in MF is underway and is expected to continue apace. The observed increase in MF sales raises serious concern for global child and maternal health, particularly in East Asia, and calls into question the efficacy of current regulatory regimes designed to protect and promote optimal IYCF. The observed changes have not been captured by existing IYCF monitoring systems.
Keywords: Breast-milk substitutes; Formula; Infant and young child feeding; Nutrition transition.
Figures


 , 2008;
  , 2013) with projections to 2018 (
 ). Data from Euromonitor Passport Global Market Information database(
32
); population estimates are for infants/children aged 0–6 months for infant formula (IF), 7–12 months for follow-up formula (FUF), 13–36 months for toddler formula (TF), 0–6 months for special formula (SF) and 0–36 months for total milk-based formula (Total MF); countries grouped by World Bank country lending categories; L-MIC, lower–middle income countries; U-MIC, upper–middle income countries; H-IC, high-income countries. Estimates for high-income countries exclude toddler formula in JPN and follow-up formula in the USA
). Data from Euromonitor Passport Global Market Information database(
32
); population estimates are for infants/children aged 0–6 months for infant formula (IF), 7–12 months for follow-up formula (FUF), 13–36 months for toddler formula (TF), 0–6 months for special formula (SF) and 0–36 months for total milk-based formula (Total MF); countries grouped by World Bank country lending categories; L-MIC, lower–middle income countries; U-MIC, upper–middle income countries; H-IC, high-income countries. Estimates for high-income countries exclude toddler formula in JPN and follow-up formula in the USA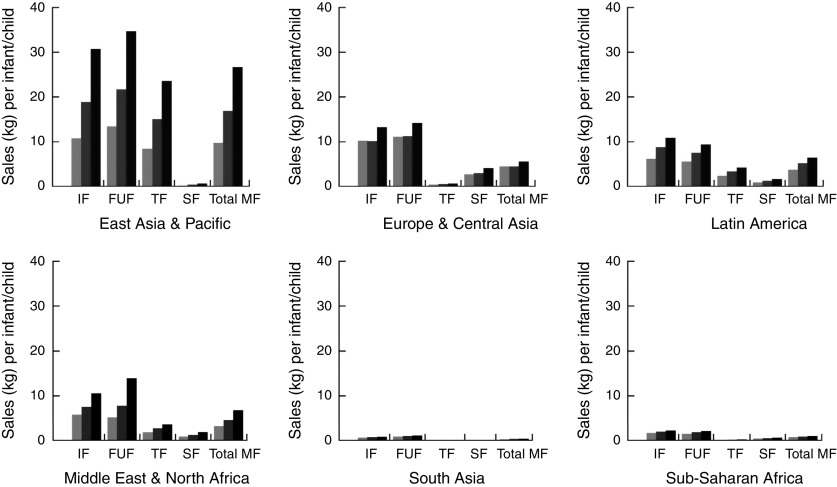 , 2008; , 2013) with projections to 2018 (). Data from Euromonitor Passport Global Market Information database(
32
); population estimates are for infants/children aged 0–6 months for infant formula (IF), 7–12 months for follow-up formula (FUF), 13–36 months for toddler formula (TF), 0–6 months for special formula (SF) and 0–36 months for total milk-based formula (Total MF). Includes data for lower–middle income countries and upper–middle income countries only (i.e. excludes high-income countries) grouped by World Bank region
, 2008; , 2013) with projections to 2018 (). Data from Euromonitor Passport Global Market Information database(
32
); population estimates are for infants/children aged 0–6 months for infant formula (IF), 7–12 months for follow-up formula (FUF), 13–36 months for toddler formula (TF), 0–6 months for special formula (SF) and 0–36 months for total milk-based formula (Total MF). Includes data for lower–middle income countries and upper–middle income countries only (i.e. excludes high-income countries) grouped by World Bank regionReferences
-
- Sankar MJ, Sinha B, Chowdhury R et al. (2015) Optimal breastfeeding practices and infant and child mortality: a systematic review and meta-analysis. Acta Paediatr 104, 3–13. - PubMed
-
- Grummer-Strawn LM & Rollins N (2015) Summarising the health effects of breastfeeding. Acta Paediatr 104, 1–2. - PubMed
-
- Jones G, Steketee RW, Black RE et al. (2003) How many child deaths can we prevent this year? Lancet 362, 65–71. - PubMed
-
- World Health Organization & UNICEF (2003) Global Strategy for Infant and Young Child Feeding. Geneva: WHO.
MeSH terms
LinkOut - more resources
Full Text Sources
Other Literature Sources
Medical
