. 2016 May 23:6:26286.
doi: 10.1038/srep26286.

Deep learning as a tool for increased accuracy and efficiency of histopathological diagnosis

Affiliations

Deep learning as a tool for increased accuracy and efficiency of histopathological diagnosis

Geert Litjens et al. Sci Rep. .

Abstract

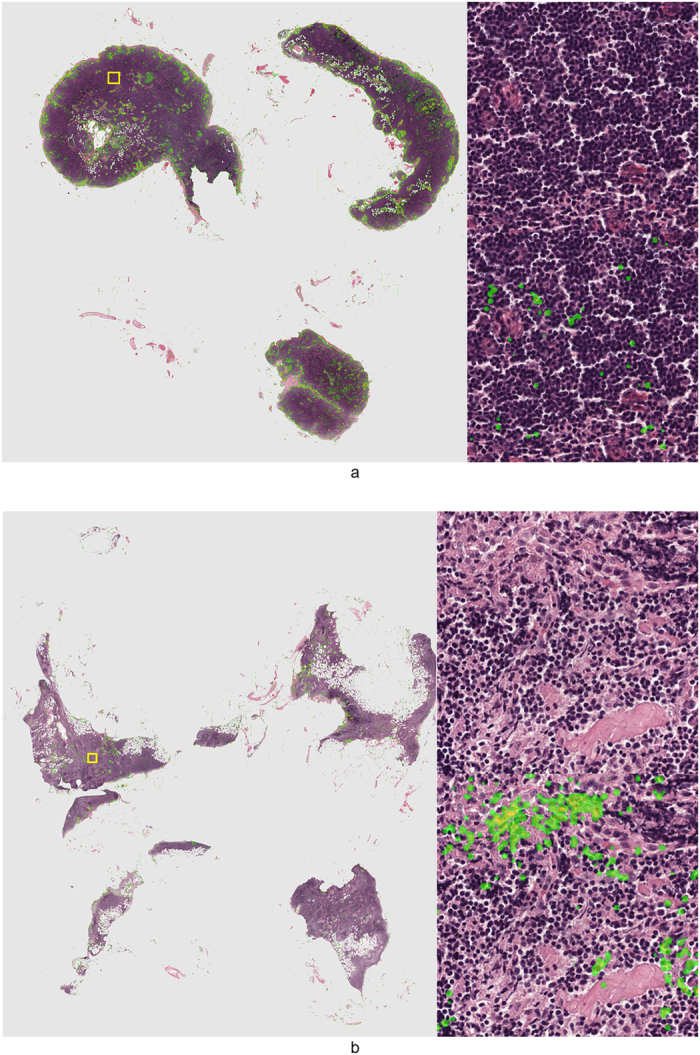
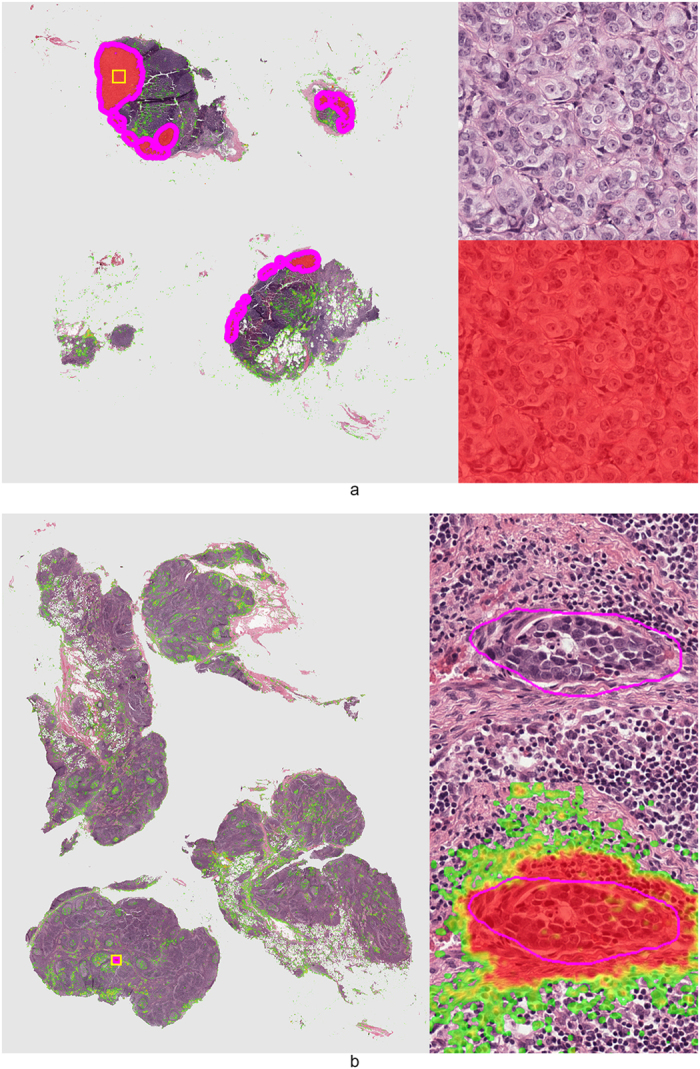
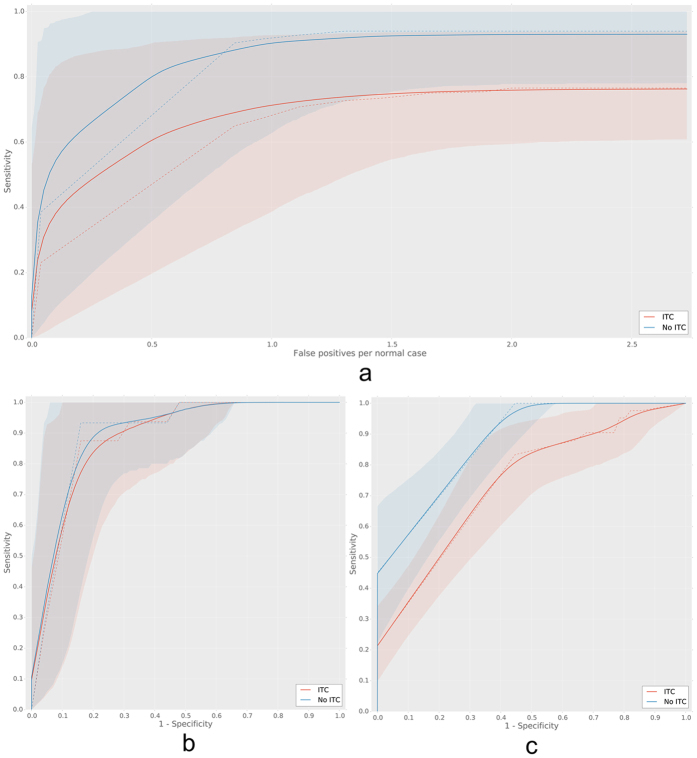
Pathologists face a substantial increase in workload and complexity of histopathologic cancer diagnosis due to the advent of personalized medicine. Therefore, diagnostic protocols have to focus equally on efficiency and accuracy. In this paper we introduce 'deep learning' as a technique to improve the objectivity and efficiency of histopathologic slide analysis. Through two examples, prostate cancer identification in biopsy specimens and breast cancer metastasis detection in sentinel lymph nodes, we show the potential of this new methodology to reduce the workload for pathologists, while at the same time increasing objectivity of diagnoses. We found that all slides containing prostate cancer and micro- and macro-metastases of breast cancer could be identified automatically while 30-40% of the slides containing benign and normal tissue could be excluded without the use of any additional immunohistochemical markers or human intervention. We conclude that 'deep learning' holds great promise to improve the efficacy of prostate cancer diagnosis and breast cancer staging.


Figures

Figure 1
Figure 1. Processing pipeline of a convolutional neural network for the detection of prostate cancer in H&E-stained whole slide biopsy specimens.
The four layers indicated with C, meaning a convolutional layer, can be considered a ‘feature extraction’-stage were consecutively higher level features are extracted from the image patch. The layers indicated by the letter M are max pooling layers which reduce image size and provide improved translational invariance to the network. The last three layers are the ‘classification’ layers (indicated with F) which, based on the given features, indicates whether the image patch contains cancer or not. Such a network can subsequently be applied to every pixel in a whole slide image in a ‘sliding window’-fashion.
Figure 2
Figure 2. Representative example of a whole slide prostate biopsy specimens with 30% cancer.
The top row shows the complete field of view, the bottom row a close up (close-up area indicated by the square rectangle). The second column shows the cancer likelihood map as an overlay on the original image. Red indicates a high likelihood of cancer, whereas transparent/green indicates a low likelihood.
Figure 3
Figure 3. Three representative examples of a whole slide prostate biopsy specimen.
Each example (ac) shows the complete field of view with the cancer likelihood map as an overlay. Red indicates a high likelihood of cancer, whereas transparent/green indicates a low likelihood. Example (a) contains around 40% cancer (indicated by the magenta outline), examples (b,c) do not contain cancer. Close-up sub-images are shown for the areas indicated by black square. For example (b) we choose to highlight a small false positive area caused by tissue deformation at the edges of the biopsy.
Figure 4
Figure 4. Receiver operating characteristic (ROC) curves for the cumulative histogram analysis in the whole-slide prostate biopsy experiment.
Two cumulative histogram parameters were used to obtain ROC curves, the median and 90th-percentile of the cumulative histogram of the whole slide images. The median ROC curve has a higher area under the curve (AUC), however, the 90th-percentile ROC curve shows higher specificity at high sensitivity. Solid lines indicate the mean bootstrapped ROC curve, the shaded areas indicate the 95th-percentile confidence intervals and the dashed line indicates the raw ROC curve.
Figure 5
Figure 5. Representative examples of normal lymph nodes from the consecutive set.
Metastases likelihood maps are overlaid on the original H&E image. Transparent/green means a low likelihood, whereas red indicates a high likelihood of metastasis. On the right side of the whole slide images the areas indicated by the yellow squares are shown at full-resolution.
Figure 6
Figure 6. Representative examples of lymph nodes with macro-metastases (top image) and a single micro-metastasis (bottom image) from the test set.
Metastases likelihood maps are overlaid on the original H&E image. Transparent/green means a low likelihood, whereas red indicates a high likelihood of metastasis. Magenta contours indicate the ground truth annotation. On the right side of the whole slide images the areas indicated by the yellow squares are shown at full-resolution.
Figure 7
Figure 7. Bootstrapped FROC and ROC curves for the lymph node experiments.
Subfigure (a) contains the FROC curve on the test set, (b) contains the ROC curve on the test set and (c) contains the ROC curve on the consecutive data. Curves for both including (red) and excluding isolated tumor cells (ITCS (blue) from the analysis are shown. Solid lines indicate the mean bootstrapped ROC curve, the shaded areas indicate the 95th-percentile confidence intervals and the dashed line indicates the raw ROC curve.

References

    1. Fischer A. H., Jacobson K. A., Rose J. & Zeller R. Hematoxylin and eosin staining of tissue and cell sections. CSH Protoc 2008, pdb.prot4986 (2008). - PubMed
    1. Epstein J. I., Allsbrook W. C., Amin M. B. & Egevad L. L. & ISUP Grading Committee. The 2005 International Society of Urological Pathology (ISUP) consensus conference on Gleason grading of prostatic carcinoma. Am. J. Surg. Pathol. 29, 1228–1242 (2005). - PubMed
    1. Genestie C. et al.. Comparison of the prognostic value of Scarff-Bloom-Richardson and nottingham histological grades in a series of 825 cases of breast cancer: major importance of the mitotic count as a component of both grading systems. Anticancer Res. 18, 571–576 (1998). - PubMed
    1. Weaver D. L. Pathology evaluation of sentinel lymph nodes in breast cancer: protocol recommendations and rationale. Mod. Pathol. 23 Suppl 2, S26–S32 (2010). - PubMed
    1. Gurcan M. N. et al.. Histopathological image analysis: a review. Biomedical Engineering, IEEE Reviews in 2, 147–171 (2009). - PMC - PubMed

Publication types