. 2016 Jun 16;165(7):1721-1733.
doi: 10.1016/j.cell.2016.04.046. Epub 2016 May 19.

Root Regeneration Triggers an Embryo-like Sequence Guided by Hormonal Interactions

Affiliations

Root Regeneration Triggers an Embryo-like Sequence Guided by Hormonal Interactions

Idan Efroni et al. Cell. .

Abstract

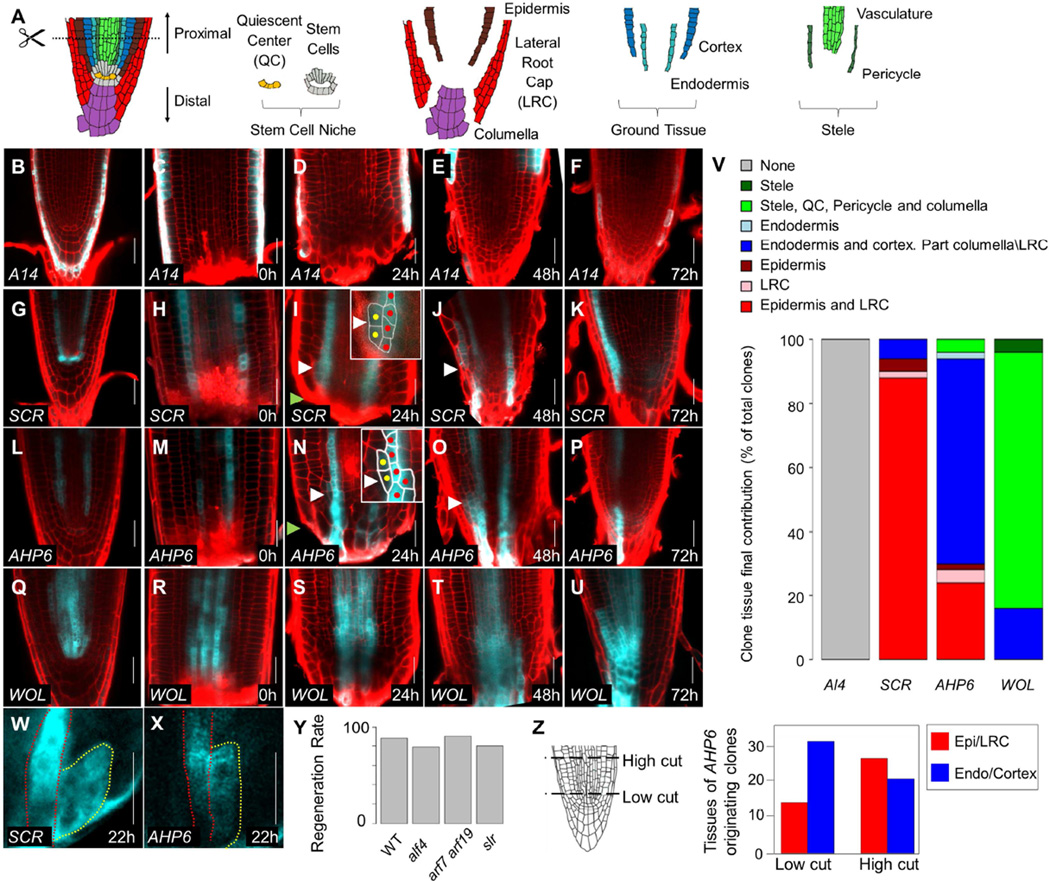
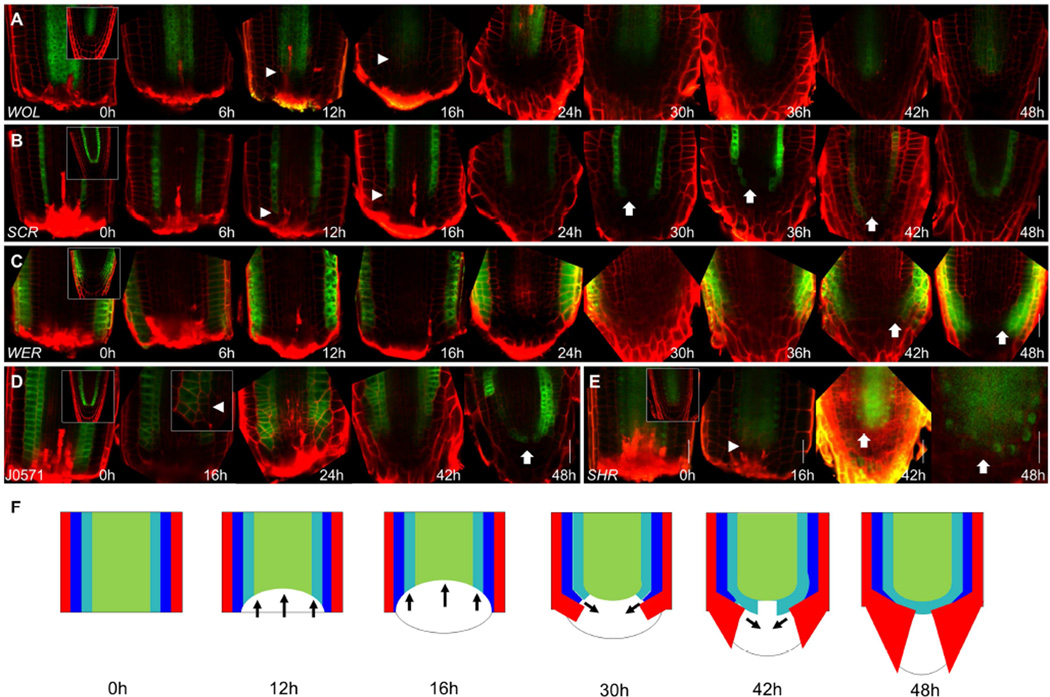
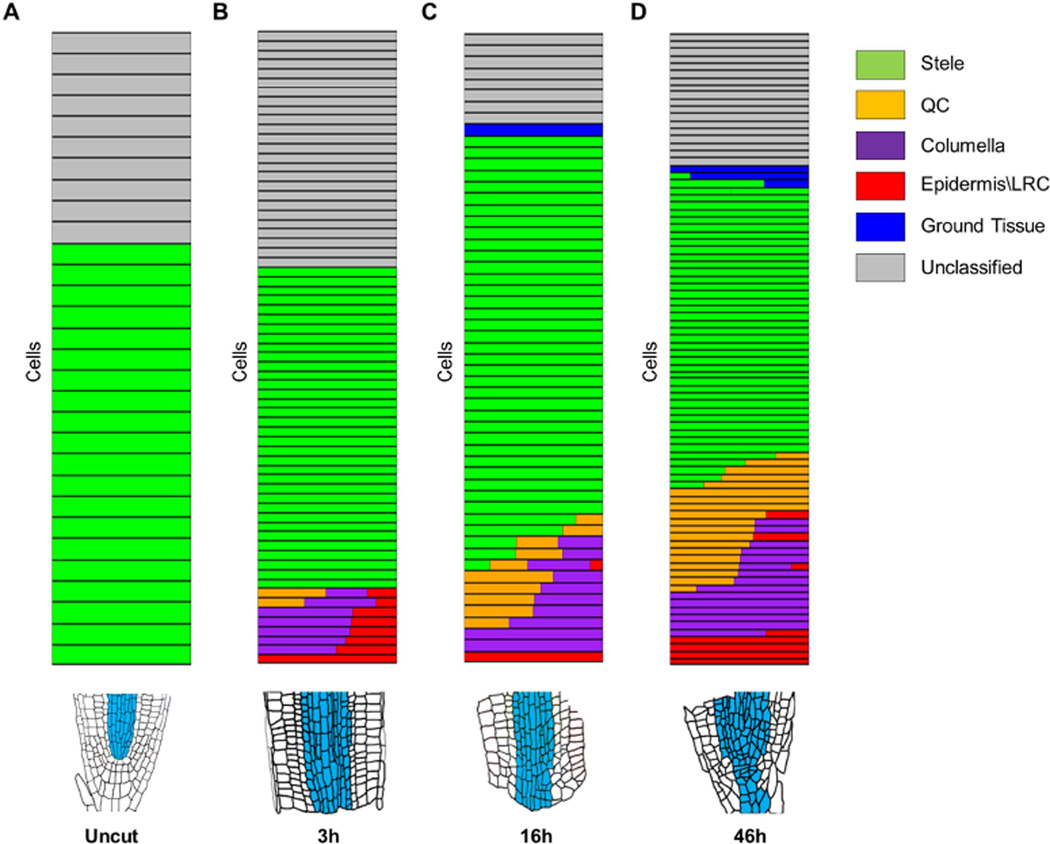
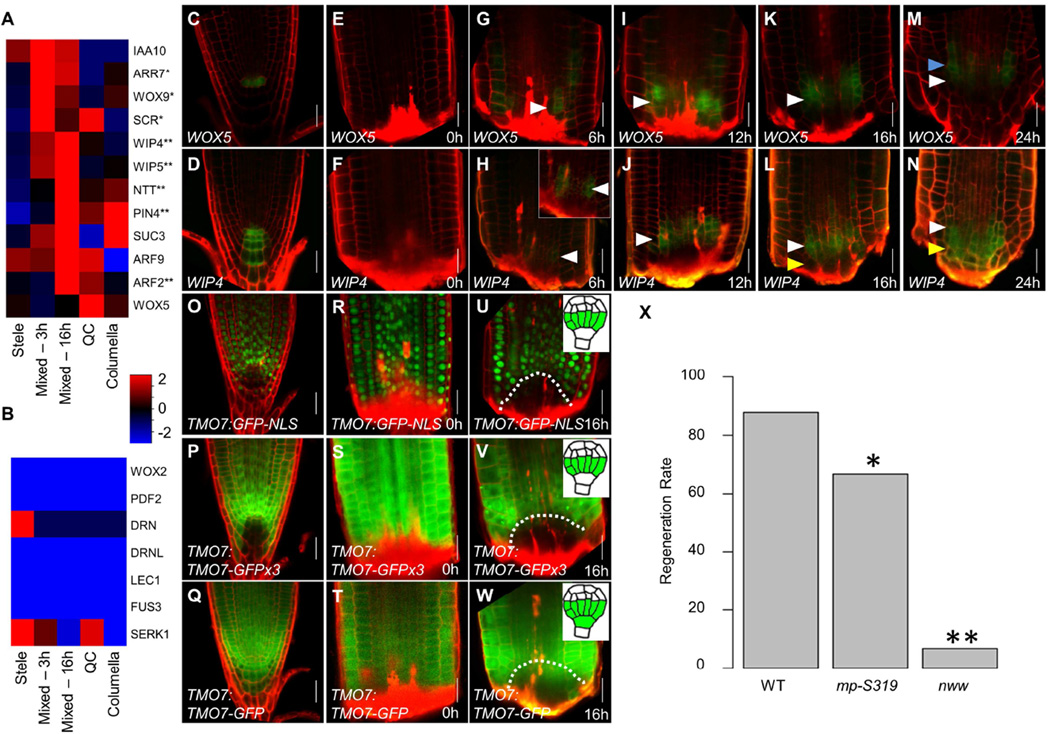
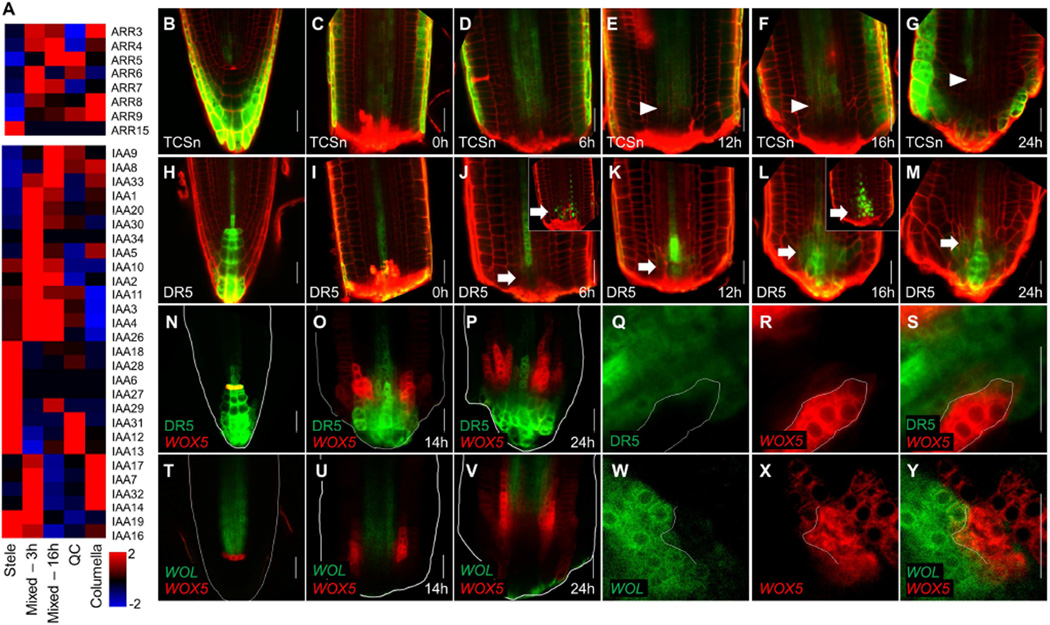
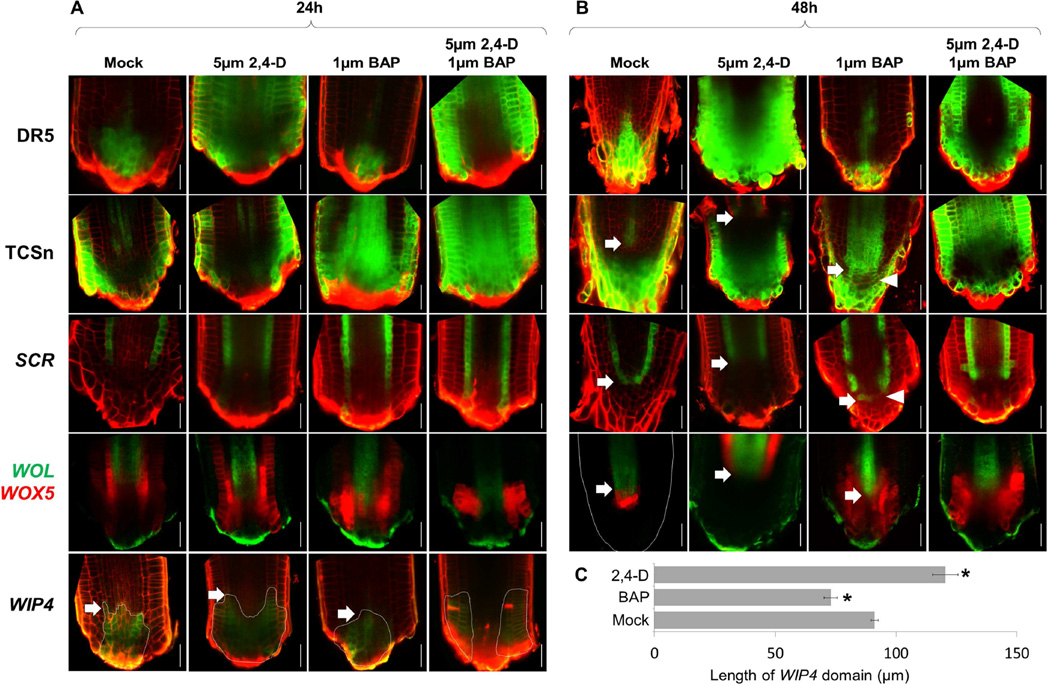
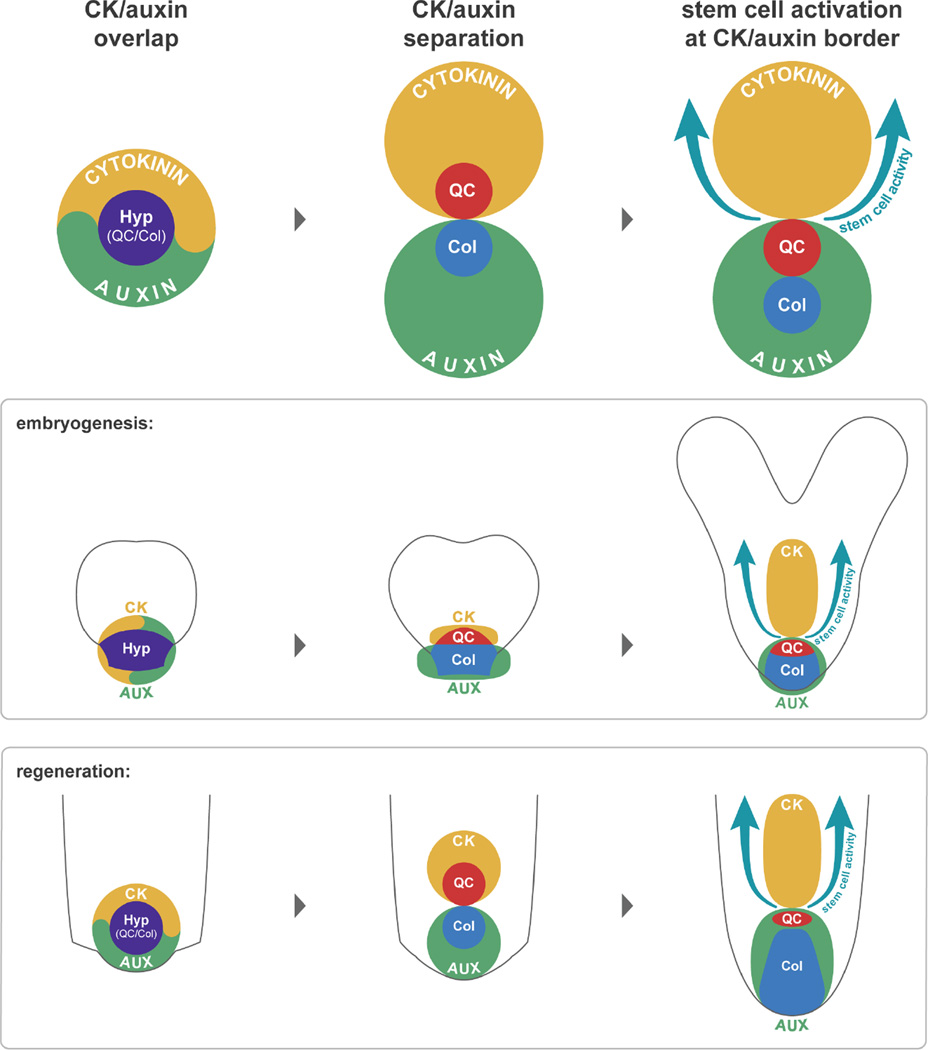
Plant roots can regenerate after excision of their tip, including the stem cell niche. To determine which developmental program mediates such repair, we applied a combination of lineage tracing, single-cell RNA sequencing, and marker analysis to test different models of tissue reassembly. We show that multiple cell types can reconstitute stem cells, demonstrating the latent potential of untreated plant cells. The transcriptome of regenerating cells prior to stem cell activation resembles that of an embryonic root progenitor. Regeneration defects are more severe in embryonic than in adult root mutants. Furthermore, the signaling domains of the hormones auxin and cytokinin mirror their embryonic dynamics and manipulation of both hormones alters the position of new tissues and stem cell niche markers. Our findings suggest that plant root regeneration follows, on a larger scale, the developmental stages of embryonic patterning and is guided by spatial information provided by complementary hormone domains.


Figures

Figure 1
Figure 1. Growth dynamics during root tip regeneration
A) Schematic representation of root meristem organization. Dotted line marks the cut site used in the study. B–U) Confocal images of tissue specific clones induced using the promoters A14 (B–F), SCR (G–K), AHP6 (L–P), and WOL (Q–U), before (B,G,L,Q),immediately after (C,H,M,R) root cutting, and at 24hpc (D,I,N,S), 48hpc (E,J,O,T), and 72hpc (F,K,P,U). Red channel is propidium iodide staining of cell walls. White arrowheads mark the presumed location of a new stem cell. Green arrowheads mark the cut site. Insets show magnified view of nascent clones. Red and yellow dots mark cells from original clone and new divisions, respectively. V) Proportions of the target tissues in fully regenerated tip for each of the clonal lines. W–X) Part of a time series tracking clones in live roots. Red line marks the original clone and yellow, new growth. See full series in Figure S1. Y) Regeneration rate of mutants in lateral root production. No significant difference was detected. Z) The identity of clones derived from an AHP6 marked tissue at 72hpc from cuts at two different heights. High cuts produced more epidermal clones than low cuts (χ2-test; n=98; p=0.014). Scale bars are 20µm.
Figure 2
Figure 2. Dynamics of loss and recovery of proximal identities
A–E) Confocal images of WOL:GFP (A), SCR:YFP (B), WER:GFP (C), J0571 (D) and SHR:SHR:GFP (E) during regeneration. Insets at 0h show uncut roots. Arrowheads mark the receding edge of the proximal identity markers. Arrows mark recovery of identity markers. Inset at (D) 16hpc shows a high magnification of the identity recession region. F) Illustration summarizing identity transition during regeneration. Red - epidermis/lateral root cap; blue – cortex; cyan – endodermis; green – stele. Arrows indicate the directions of identity recession and recovery. Scale bars are 20µm.
Figure 3
Figure 3. Identity of single cells isolated from regenerating roots
A–D) Relative cell identity in individual cells isolated from uncut (A) and 3hpc (B), 16hpc (C) and 46hpc (D). Each row represents a single cell. Identity is shown as a color-coded bar consisting of the normalized ICI score for each tissue type. Multiple color bars in a single row indicate mixed-identity within a single cell. Blue sectors in root illustrations (bottom) represent the domains from which single cells were isolated.
Figure 4
Figure 4. Proximodistal domain separation resembles embryonic hypophysis division
A–B) Mean expression values of known hypophysis (A) or embryonic but non-hypophysis (B) expressed genes in single cells grouped according to their identity. * and ** marks significant upregulation at 3h or 16h, respectively (p<0.05; Wilcoxon test). C–N) Confocal images of WOX5 (C,E,G,I,K,M) and WIP4 (D,F,H,J,L,N) reporters over the first 24 hours of regeneration. Blue, white, and yellow arrowheads mark the forming proximal, overlapping, and distal domains, respectively. Inset shows magnified and gain-enhanced GFP signal. O–W) Confocal images of transcriptional (O–U) and translational non-mobile (P–V) and mobile (Q–W) reporters of TMO7. Inset at 16h show the embryonic expression of each reporter. Dotted line marks the region of identity loss. X) Regeneration rate of mutants defective in hypophysis division. * p=0.02; ** p<1E-10; χ2-test. Scale bars are 20µm.
Figure 5
Figure 5. Expression of hormonal response markers during proximodistal domain separation
A) Mean expression values in single cells, grouped by identity, of A-class ARR (top) or AUX/IAA (bottom) gene families. B–M) Expression of the cytokinin marker TCSn (B–G) and auxin marker DR5 (H–M) during regeneration. Arrowheads mark the recession of the TCSn signal. Arrows mark induction of DR5. Insets in (J) and (L) show expression of the rapid maturing DR5rev:NLS-3xVenus at the corresponding time points. N–P) Dual marker expression of DR5 (green) and WOX5 (red) before cutting (N) and at 14hpc (P) or 24hpc (P). Q–S) An invading sector of WOX5 (red) expression in the DR5 (green) domain in single channel (Q–R) and overlay (S) at 14hpc. T–Y) Confocal image of WOL (green) WOX5 (red) plants, before cut (T) and at 14hpc (U) and 24hpc (V), including high magnification of a WOX5 invading sector (W–Y) at 14hpc. Scale bars are 20µm.
Figure 6
Figure 6. Effects of hormone treatment on meristem patterning
A–B) Confocal images of mock, 2,4-D, BAP, or 2,4-D and BAP treated regenerating roots at 24hpc (A) and 48hpc (B). Arrows mark proximodistal shifts in position of markers compared to mock treated control. Arrowheads mark sporadic cytokinin signaling expansion and concomitant loss of SCR expression. C) Length of WIP4 domain at 24hpc under different treatments. Error bars are standard error. n=8 for each treatment. * marks significantly different than mock (Student’s ttest, p<1E-4 for BAP, p<1E-3 for 2,4-D). Scale bars are 20µm.
Figure 7
Figure 7. A general model for root regeneration
Similar to embryonic root development, regeneration initiates with a transient overlap of auxin and cytokinin signaling, which then separates to a proximal cytokinin and a distal auxin domain, providing spatial cues for the root cap, stem cell niche, and proximal identities.

References

    1. Aida M, Beis D, Heidstra R, Willemsen V, Blilou I, Galinha C, Nussaume L, Noh YS, Amasino R, Scheres B. The PLETHORA genes mediate patterning of the Arabidopsis root stem cell niche. Cell. 2004;119:119–120. - PubMed
    1. Alvarado AS, Tsonis Pa. Bridging the regeneration gap: genetic insights from diverse animal models. Nat. Rev. Genet. 2006;7:873–884. - PubMed
    1. Atta R, Laurens L, Boucheron-Dubuisson E, Guivarc’h A, Carnero E, Giraudat-Pautot V, Rech P, Chriqui D. Pluripotency of Arabidopsis xylem pericycle underlies shoot regeneration from root and hypocotyl explants grown in vitro. Plant J. 2009;57:626–644. - PubMed
    1. Bellini C, Pacurar DI, Perrone I, Bellini Catherine, Pacurar Daniel I, Perrone Irene. Adventitious roots and lateral roots: similarities and differences. Annu. Rev. Plant Biol. 2014;65:639–666. - PubMed
    1. Bennett T, Scheres B. Root development-two meristems for the price of one? Curr. Top. Dev. Biol. 2010;91:67–102. - PubMed

Publication types