. 2016 Jun 16;165(7):1686-1697.
doi: 10.1016/j.cell.2016.04.047. Epub 2016 May 19.

Coexisting Liquid Phases Underlie Nucleolar Subcompartments

Affiliations

Coexisting Liquid Phases Underlie Nucleolar Subcompartments

Marina Feric et al. Cell. .

Abstract

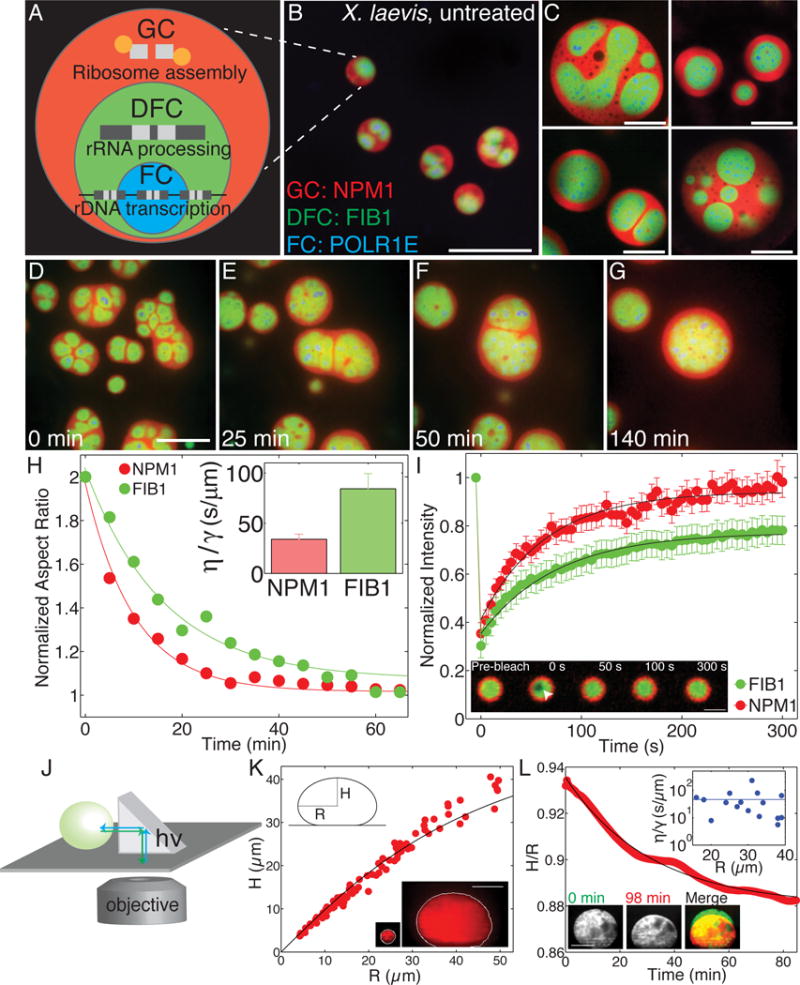
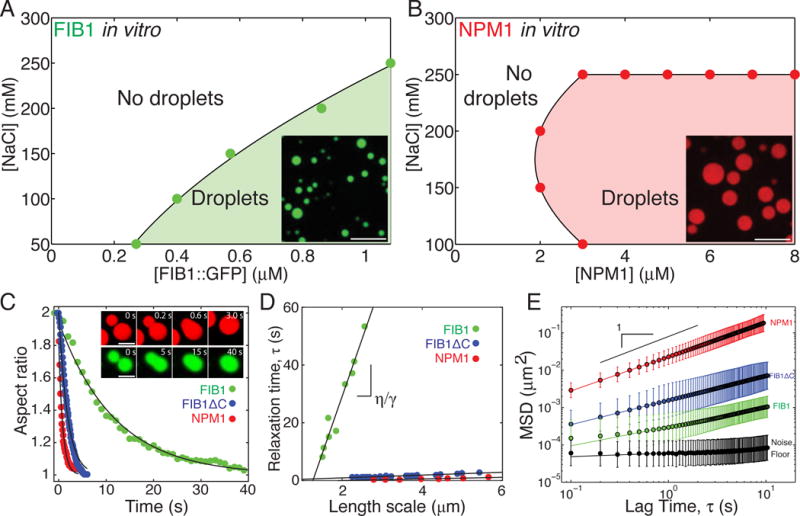
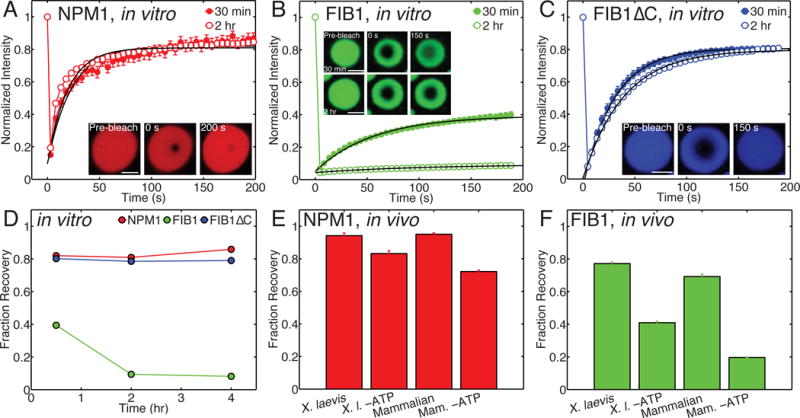
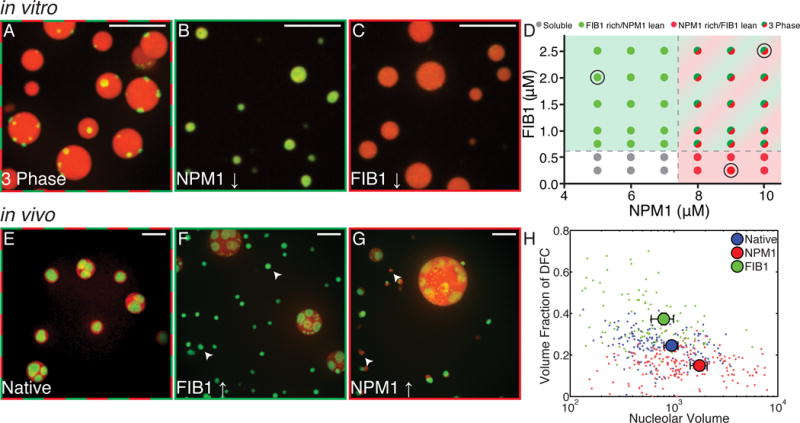
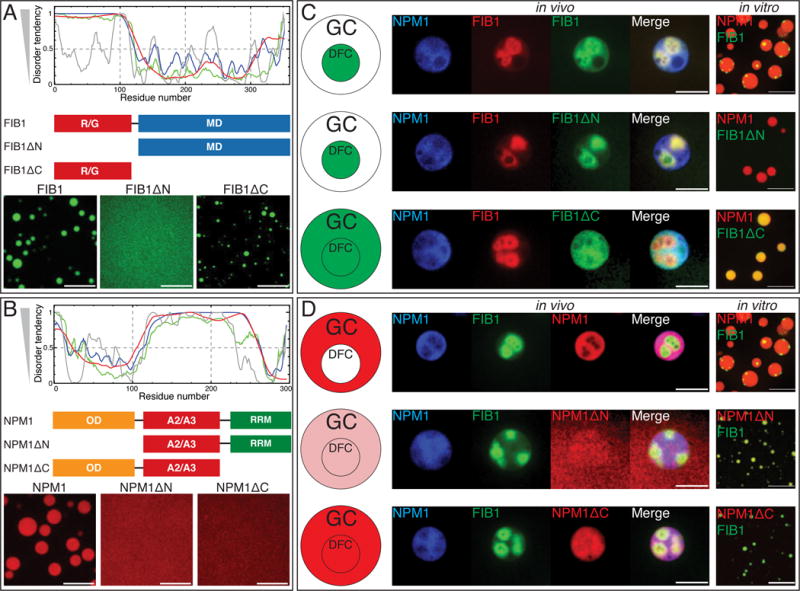
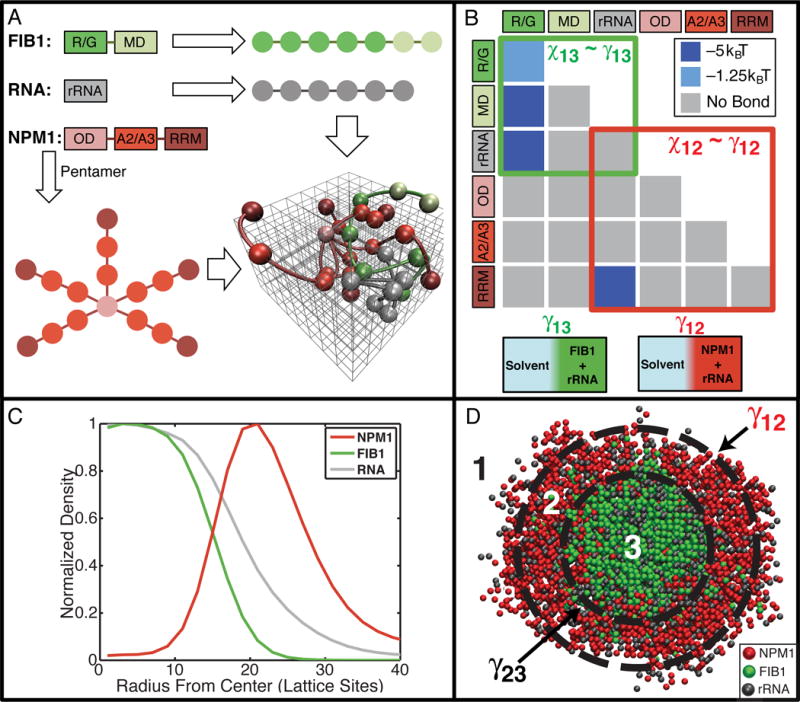
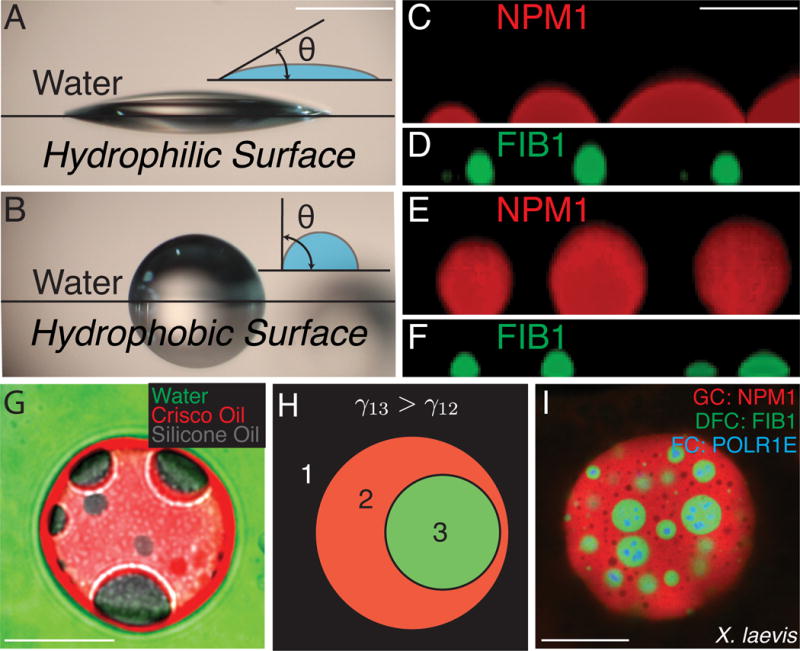
The nucleolus and other ribonucleoprotein (RNP) bodies are membrane-less organelles that appear to assemble through phase separation of their molecular components. However, many such RNP bodies contain internal subcompartments, and the mechanism of their formation remains unclear. Here, we combine in vivo and in vitro studies, together with computational modeling, to show that subcompartments within the nucleolus represent distinct, coexisting liquid phases. Consistent with their in vivo immiscibility, purified nucleolar proteins phase separate into droplets containing distinct non-coalescing phases that are remarkably similar to nucleoli in vivo. This layered droplet organization is caused by differences in the biophysical properties of the phases-particularly droplet surface tension-which arises from sequence-encoded features of their macromolecular components. These results suggest that phase separation can give rise to multilayered liquids that may facilitate sequential RNA processing reactions in a variety of RNP bodies. PAPERCLIP.


Figures

Figure 1
Figure 1. Liquid-like behavior of biophysically distinct nucleolar sub-compartments
(A) Schematic diagram of ribosome biogenesis in nucleolus. (B) Nucleoli in an untreated X. laevis nucleus. Scale bar = 20 μm. For all images, granular component (GC) is visualized with NPM1 (red), dense fibrillar component (DFC) with FIB1 (green), and fibrillar center (FC) with POLR1E (blue). (C) Examples of nucleoli after coarsening in X. laevis nuclei treated with Lat-A. Scale bar = 20 μm. (D–G) Time-course of nucleolar component fusion after actin disruption by Lat-A. Scale bar = 20 μm. (H) Normalized aspect ratio vs. time for nucleolar components fusing after actin disruption. Inset shows η/γ for 59 nucleoli analyzed from 20 nuclei. (I) FRAP recovery curves for NPM1 (red) and FIB1 (green) in X. laevis oocytes. Inset: FRAP of FIB1-labeled DFC (green). Scale bar = 5 μm. (J) Schematic illustrating XZ imaging with a right angle prism. (K) Height, H, vs. radius, R, of different sized nucleoli at steady-state (91 nucleoli, from 61 nuclei). Black line is the fit from the average surface tension for all nucleoli. Bottom inset: example of the shape of a small vs. large nucleolus. Scale bar = 40 μm. (L) Example of nucleolar height to radius ratio, H/R, vs. time for one nucleolus deforming under gravity. Black line is an exponential fit. Top inset: η/γ for 16 nucleoli in 16 different nuclei. Blue line indicates average. Bottom inset shows example deforming nucleolus: Scale bar = 40 μm. See also Figure S1 and Movies S1, S2, S3, and S4.
Figure 2
Figure 2. Purified nucleolar proteins can phase separate into droplets with different biophysical properties
(A) Phase diagram of purified FIB1 in the presence of 5 μg/ml of rRNA. Inset: FIB1 droplets. Scale bar = 10 μm. (B) Phase diagram of purified NPM1 in the presence of 100 μg/ml of rRNA. Inset: NPM1 droplets. Scale bar = 10 μm. (C) Aspect ratio vs. time for fusing droplets of FIB1 (green), NPM1 (red), and FIB1ΔC (blue). Inset: FIB1 fusing (scale = 2 μm) and NPM1 fusing (scale = 5 μm). (D) Relaxation time versus length scale for fusion data from multiple FIB1 (green), NPM1 (red), and FIB1ΔC droplets (blue). (E) MSD vs. lag time of microrheological probe particles (R=50 nm) embedded in droplets of FIB1 (green), NPM1 (red), or FIB1ΔC (blue); black data points represent the noise floor (black). See also Figure S2.
Figure 3
Figure 3. Nucleolar protein droplets exhibit liquid-like dynamics, but FIB1 shows evidence for aging
(A–C) FRAP recovery curves for NPM1 (red), FIB1 (green), and FIB1ΔC (blue) droplets, 30 minutes (closed circles) and 2 hours (open squares) after phase separation was initiated. (A) Inset: example FRAP timecourse. Scale bar = 5 μm. (B) Insets: example FRAP timecourses after 30 minutes (top) and 2 hours (bottom). Scale bar = 2 μm. (C) Inset: example FRAP timecourse. Scale bar = 2 μm. (D) Fraction recovery after FRAP experiment as a function of time after phase separation for NPM1 (red), FIB1 (green), and FIB1ΔC (blue) droplets. (E,F) Fraction recovery for NPM1 (E) and FIB1 (F) in X. laevis nucleoli and mammalian cell culture nucleoli in vivo, for native and ATP depletion conditions. See also Figure S3.
Figure 4
Figure 4. FIB1 and NPM1 form immiscible droplets in vitro and in vivo
(A–C) In vitro images of mixtures of purified NPM1 and FIB1. Scale bar = 10 μm. (A) High concentrations of both proteins (FIB1: 2.5 μM, NPM1: 10 μM) give rise to FIB1-rich droplets (green) which are immiscible with and partially enveloped by NPM1-rich droplets (red). (B) For much lower concentrations of NPM1 (NPM1: 5 μM, FIB1: 2 μM) only FIB1-rich/NPM1-lean droplets are observed. (C) For much lower concentrations of FIB1 (FIB1: 0.25 μM, NPM: 9 μM) only NPM1-rich/FIB1-lean droplets are observed. (D) Phase diagram for varying concentrations of NPM1 and FIB1 in vitro. Colors represent observed phase (gray = soluble phase, green = FIB1 rich/NPM1 lean phase, red = NPM1 rich/FIB1 lean phase, and red/green = three phase). Black circles indicate concentrations shown in A, B, and C. (E–G) Images of nucleoli in X. laevis; red=NPM1, green=FIB1. Scale bar = 10 μm. (E) Untreated nuclei. (F) Nuclei after microinjection of FIB1 (G) Nuclei after microinjection of NPM1. (H) Volume fraction of the DFC (identified by FIB1) in each nucleolus for native nuclei (blue), after NPM1 injection (red) and after FIB1 injection (green). Large symbols represent mean ± s.e.m. See also Figure S4.
Figure 5
Figure 5. Molecular mechanism of phase partitioning in X. laevis oocytes
(A) Domain analysis of FIB1. Plot shows predicted disorder across full length FIB1 using various algorithms, P-FIT (green line), VSL2B (blue line), VL3 (red line), and VLXT (grey line). Schematic diagrams show three constructs: FIB1 full length, R/G deletion (FIB1ΔN), and deletion of MD (FIB1ΔC), with images below testing for constructs’ ability to form droplets. Scale bar = 10 μm. (B) Domain analysis of NPM1. Predicted disorder across full length NPM1 for the four algorithms. Schematic diagrams show three constructs: NPM1 full length, oligomerization deletion (NPM1ΔN), and RNA binding deletion (NPM1ΔC) with images below testing for constructs’ ability to form droplets. Scale bar = 10 μm. (C,D) The left most panel shows schematic summary of center panels. Center panels contain images from X. laevis nucleoli in vivo. Left channel contains expression of mRNA for NPM1::Cerulean, followed by expression of mRNA for FIB1::RFP or GFP, followed by injection of various constructs (FIB1, FIB1ΔN, FIB1ΔC, NPM1, NPM1ΔN, NPM1ΔC), and final image is the overlay of all three channels. Scale bar = 10 μm. The right most panel shows in vitro images of FIB1 or mutants (green) mixed with NPM1 droplets (red) or NPM1 or mutants (red) mixed with FIB1 droplets (green). Scale bar = 10 μm. See also Figure S5.
Figure 6
Figure 6. Preferential interaction model captures the formation of spatially organized droplets for the ternary system comprising of FIB1, NPM1, and rRNA
(A) Mapping of the sequences of FIB1, NPM1, and rRNA to linear/branched polymers of modules on three-dimensional lattices. FIB1 is modeled as a linear polymer comprising of seven modules, five corresponding to the R/G domain and two corresponding to the MD. Similarly, the rRNA sequence is modeled as a linear polymer comprising six modules. NPM1 is modeled as a branched polymer with five arms. Here, the ODs of five NPM1 molecules occupy the base for each branch; two modules correspond to the intrinsically disordered acid-rich regions (A2/A3) and a single module captures the RNA recognition module (RRM). A representative snapshot is shown of polymers on the cubic lattice. (B) The matrix of module interaction strength. (C) The normalized mean radial density of FIB1 (green), NPM1 (red), and RNA (grey) for representative largest cluster observed throughout a simulation. (D) Visual depiction of a slice through representative phase separated droplet; FIB1 (green) and NPM1 (red). See also Figure S6 and Movie S5.
Figure 7
Figure 7. Surface tension drives organization of multiphase droplets
(A–F). Images of droplets on hydrophilic surfaces (Pluronic-treated, A) or hydrophobic surfaces (Sigmacote-treated, B). (A) Water droplet on hydrophilic surface. (B) Water droplets on hydrophobic surface. Scale bar for A, B = 1 mm. (C) NPM1 droplets on hydrophilic surface. (D) FIB1 droplets on hydrophilic surface. (E) NPM1 droplets on hydrophobic surface. (F) FIB1 droplets on hydrophobic surface. Scale bar for C–F= 5 μm. (G) Image of non-biological multiphase droplets: green=water, red=Crisco oil, and gray=silicone oil. Scale bar = 20 μm. (H) Schematic organization of immiscible multiphase droplets. The more hydrophobic phase (green), has a higher surface tension with water than the more hydrophilic phase (red), which has a lower surface tension with water. (I) Image of multiphase nucleoli after actin disruption in X. laevis. Scale bar = 20 μm. See also Figure S7.

References

    1. AARTS DG, SCHMIDT M, LEKKERKERKER HN. Direct visual observation of thermal capillary waves. Science. 2004;304:847–850. - PubMed
    1. BALAGOPAL V, PARKER R. Polysomes, P bodies and stress granules: states and fates of eukaryotic mRNAs. Current opinion in cell biology. 2009;21:403–408. - PMC - PubMed
    1. BERRY J, WEBER SC, VAIDYA N, HAATAJA M, BRANGWYNNE CP. RNA transcription modulates phase transition-driven nuclear body assembly. Proceedings of the National Academy of Sciences. 2015;112:E5237–E5245. - PMC - PubMed
    1. BOISVERT FM, VAN KONINGSBRUGGEN S, NAVASCUES J, LAMOND AI. The multifunctional nucleolus. Nat Rev Mol Cell Bio. 2007;8:574–585. - PubMed
    1. BRANGWYNNE CP, ECKMANN CR, COURSON DS, RYBARSKA A, HOEGE C, GHARAKHANI J, JULICHER F, HYMAN AA. Germline P granules are liquid droplets that localize by controlled dissolution/condensation. Science. 2009;324:1729–1732. - PubMed

Publication types