. 2016 Jun 2;165(6):1347-1360.
doi: 10.1016/j.cell.2016.04.013. Epub 2016 May 19.

Sleep Drive Is Encoded by Neural Plastic Changes in a Dedicated Circuit

Affiliations

Sleep Drive Is Encoded by Neural Plastic Changes in a Dedicated Circuit

Sha Liu et al. Cell. .

Abstract

Prolonged wakefulness leads to an increased pressure for sleep, but how this homeostatic drive is generated and subsequently persists is unclear. Here, from a neural circuit screen in Drosophila, we identify a subset of ellipsoid body (EB) neurons whose activation generates sleep drive. Patch-clamp analysis indicates these EB neurons are highly sensitive to sleep loss, switching from spiking to burst-firing modes. Functional imaging and translational profiling experiments reveal that elevated sleep need triggers reversible increases in cytosolic Ca(2+) levels, NMDA receptor expression, and structural markers of synaptic strength, suggesting these EB neurons undergo "sleep-need"-dependent plasticity. Strikingly, the synaptic plasticity of these EB neurons is both necessary and sufficient for generating sleep drive, indicating that sleep pressure is encoded by plastic changes within this circuit. These studies define an integrator circuit for sleep homeostasis and provide a mechanism explaining the generation and persistence of sleep drive.


Figures

Figure 1
Figure 1
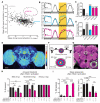
Activation of R2 ring neurons induces sleep drive. (A) Scatterplot of % change in sleep amount during and after dTrpA1 activation from 505 Gal4 lines driving expression of dTrpA1. The solid trend line shows the inverse correlation between amount of sleep during and following dTrpA1 activation. Drivers with significantly increased sleep following dTrpA1 activation, accompanied by a lack of reduced sleep during dTrpA1 activation are indicated in magenta and the dashed ellipse. (B) Sleep profile of wt>UAS-dTrpA1 flies (black circles, n=62) vs R52B10-Gal4>UAS-dTrpA1 (upper panel, gray squares, n=32), R72G06-Gal4>UAS-dTrpA1 (middle panel, cyan squares, n=32), or R69F08-Gal4>UAS-dTrpA1 (lower panel, magenta squares, n=42). Sleep time was plotted in 30 min bins. White and black bars indicate 12 hr light and dark periods, respectively. 12 hr dTrpA1 activation at 29°C is indicated. (C and D) Sleep amount over a 12 hr period during (C) and after (D) dTrpA1 activation for wt>UAS-dTrpA1, R52B10-Gal4>UAS-dTrpA1, R72G06-Gal4>UAS-dTrpA1, R69F08-Gal4>UAS-dTrpA1, and R58H05-Gal4>UAS-dTrpA1 (n=24) flies. Data for all lines except R58H05-Gal4>UAS-dTrpA1 are from the same flies as in Figure 1B. (E) Heat map of the averaged GFP signal from the expression patterns of the 8 drivers indicated in magenta in Figure 1A. Image is presented using a “royal” look-up table, and scale is shown on the right. Scale bar denotes 100μm. (F) Schematic showing organization of the ring neurons of the ellipsoid body. Upper panel depicts the location of cell bodies, lateral triangle (post-synaptic sites) and ellipsoid rings (pre- and post- synaptic sites) of the ring neurons. Lower panel illustrates ellipsoid body ring anatomy: R1, R2, R3 and R4 ring structures are indicated. (G) Whole-mount brain immunostaining of a R69F08-Gal4>UAS-IVS-Syn21-GFP-p10 animal with anti-GFP (green) and anti-Bruchpilot (BRP, nc82, magenta). Maximal intensity projection of the central brain is shown. Scale bar denotes 100μm. Bottom right inset shows a high-magnification section of the R2 ring structure. Arrowhead indicates the R2 ring. Arrow indicates the R4 ring. (H) Arousal threshold after dTrpA1 activation. The percentage of flies aroused by mild (0.1g), moderate (0.5g), and strong (1.2g) mechanical rotational stimuli at ZT2 after cessation of dTrpA1 activation. Data from UAS-dTrpA1/+ (n=96 for mild, n=75 for moderate, n=64 for strong), R69F08-Gal4/+ (n=96 for mild, n=76 for moderate, n=48 for strong), R69F08-Gal4/UAS-dTrpA1 (n=60 for mild, n=89 for moderate, n=48 for strong), R58H05-Gal4/+ (n=96 for mild, n=84 for moderate, n=44 for strong) and R58H05-Gal4/UAS-dTrpA1 (n=93 for mild, n=48 for moderate, n=48 for strong) flies are shown. (I) Sleep propensity of UAS-dTrpA1/+, R69F08-Gal4/+, R69F08-Gal4/UAS-dTrpA1, R58H05-Gal4/+ and R58H05-Gal4/UAS-dTrpA1 flies after dTrpA1 activation. % flies falling asleep within 5 mins (left panel) and sleep latency (right panel) after arousal are shown. Mean ± SEM is shown. In this and subsequent figures “*”, “**”, “***”, and “ns” denote P<0.05, P<0.01, P<0.001, and not significant, respectively. (See also Figure S1)
Figure 2
Figure 2
R2 neurons are required and act through ExFl2 neurons to regulate sleep homeostasis. (A) Sleep profiles of flies undergoing sleep deprivation. Sleep-deprived (black or magenta squares) and no sleep deprivation controls (gray circles) are shown for wt>UAS-TNT flies (upper panel, n=37 and 36 for sleep-deprived and controls, respectively) and R69F08-Gal4>UAS-TNT (lower panel, n=32 and 37 for sleep-deprived and controls, respectively). Sleep time plotted in 30 min bins. White and black bars indicate 12 hr light and dark periods, respectively. The 12 hr sleep deprivation period is indicated. (B) % sleep recovered during the 6 hrs following sleep deprivation for control (wt>UAS-TNT), R69F08-Gal4>UAS-TNT, R58H05-Gal4>UAS-TNT (n=25), R30G03-Gal4>UAS-TNT (n=25), R35D04-Gal4>UAS-TNT (n=35) and R59B03-Gal4>UAS-TNT (n=28) flies. Data for R69F08-Gal4>UAS-TNT and wt>UAS-TNT are from the same flies as in Figure 2A. (C) % aroused for wt>UAS-TNT (n=159 for moderate stimuli and n=128 for strong stimuli) and R69F08-Gal4>UAS-TNT (n=163 for moderate stimuli and n=132 for strong stimuli) flies subjected to moderate (0.5g) and strong (1.2g) mechanical rotational stimuli at ZT2 during rebound sleep. Mean ± SEM is shown. (D) Proposed model of R2 neurons acting upstream of the ExFl2 neurons in the homeostatic regulation of sleep. Signaling from the R2 to ExFl2 neurons is likely indirect, since the pre-synaptic terminals of the R2 neurons are in the ellipsoid body ring while the post-synaptic processes of the ExFl2 neurons are in the dorsal protocerebrum. Although the ExFl2 neurons are shown as the sole target of R2 signaling, additional downstream sleep “effector” circuits may exist. (E) Sleep profiles of R72G06-LexA; UAS-dTrpA1 (green diamonds, n=26), wt>LexAop-TNT; R69F08-Gal4>UAS-dTrpA1 (magenta circles, n=44), R72G06-LexA>LexAop-TNT; wt>UAS-dTrpA1 (cyan triangles, n=30), and R72G06-LexA>LexAop-TNT; R69F08-Gal4>UAS-dTrpA1 (black squares, n=34) flies. Sleep time plotted in 30 min bins. White and black bars indicate 12 hr light and dark periods, respectively. 12 hr dTrpA1 activation at 28°C is indicated. (F) Sleep amount during the 12 hrs after dTrpA1 activation. Data are from the same flies as in Figure 2E. Mean ± SEM is shown. (G) Mean GCaMP responses in cell bodies of ExFl2 neurons from R69F08-Gal4>UAS-P2X2; R72G06-LexA>LexAop-GCaMP6s (cyan trace, n=6) and UAS-P2X2; R72G06-LexA>LexAop-GCaMP6s (black trace, n=5) flies. Black bar denotes time of perfusion 5mM ATP. (See also Figure S2)
Figure 3
Figure 3
R2 ring neuron activity and excitability correlate with level of sleep need. (A) Schematic of the different time points for perforated patch-clamp recordings. Recordings were performed from ZT0-ZT2 (ZT0), ZT13-15 (ZT13), and sleep-deprived flies (SD). (B) Quantification of spontaneous action potential frequency of the R2 neurons from ZT0 (n=8), ZT13 (n=6) and SD (n=8) flies. (C) Bursting frequency of the R2 neurons under baseline conditions and following sleep deprivation. Data in Figures 3B and 3C are from the same recordings. Bursting events were not observed in R2 neurons under baseline conditions, whereas they were seen in 6 of 8 recordings from sleep-deprived flies. (D) Representative whole-cell current-clamp recordings of R2 neurons from ZT0-ZT2, ZT13-ZT15, and following sleep deprivation. Dashed box highlights the bursting event in a sleep-deprived animal. (E) Representative traces for evoked response to 60 pA current injections. Data from flies at ZT0-ZT2, ZT13-ZT15, and following sleep deprivation are shown in cyan, green, and magenta respectively. (F) Mean AP frequency evoked in response to current injections with 300-ms stepping pulses at 20 pA increments ranging from 20 pA to 100 pA. Mean ± SEM is shown. (See also Figure S3)
Figure 4
Figure 4
Structural plastic changes in the R2 circuit correlate with sleep need. (A) Schematic of the different time points for measurement of BRP, an active zone component. (B) Representative images of BRP signal in the R2 neurons (R69F08-Gal4>STaR, upper panels) and in antennal lobe local interneurons (R24C12-Gal4>STaR, lower panels) in No SD, 2 hr after SD and 24 hr after SD flies. Sum intensity projections of the R2 region are shown. Scale bar denotes 20 μm. (C) Relative levels of BRP signal intensity in the presynaptic region of R2 neurons (R2 EB) in No SD (n=19), 2 hr after SD (n=19) and 24 hr after SD animals (n=16) and relative levels of BRP signal in antennal lobe local interneurons (AL) in No SD (n=10), 2 hr after SD (n=11) and 24 hr after SD animals (n=10). Simplified box plots are shown, where the line inside the box indicates the median, and the top and bottom represent 75% and 25% percentile, respectively. (D) The number and size of the BRP puncta in the R2 rings in No SD (n=19), 2 hr after SD (n=19) and 24 hr after SD animals (n=16). These data are from the same flies as in Figure 4C. (See also Figure S3)
Figure 5
Figure 5
Intracellular Ca2+ within R2 neurons reflects level of sleep drive in scalable manner. (A) Mechanical sleep deprivation of R30G03-Gal4>CaLexA flies. Sleep profiles of flies subjected to “no sleep deprivation” (No SD, gray circles, n=22) or 24 hr sleep deprivation (SD, magenta squares, n=20) are shown. Gray and black bars indicate 12 hr subjective day and night, respectively. (B) Whole-mount brain immunostaining of SD vs no SD R30G03-Gal4>CaLexA flies using anti-GFP. Maximal intensity projections of the central complex region are shown in pseudocolor. Scale bar denotes 20 μm. Dashed lines indicate the R2 ring of the ellipsoid body (EB). (C) Relative levels of GFP signal in the R2 EB and Fan-shaped body (FB) in No SD and SD flies from Figure 5A. Note that the FB neurons in Figures 5C and 5H are not the ExFl2 cells. (D) Relative levels of GFP signal in R2 EB and dorsal anterior lateral (DAL) neurons in R58H05-Gal4>CaLexA flies under No SD (n=10) and SD (n=11) conditions. (E) Schematic showing the paradigm used for CaLexA measurements in very young (1 day old) vs older (7-9 days old) flies. (F) Representative whole-mount brain immunostaining of Day 1- vs Day 8-old R58H05-Gal4>CaLexA animals. Maximal intensity projections of the R2 ring are shown in pseudocolor. Scale bar denotes 20 μm. (G) Relative GFP signal in R2 EB and DAL for 1 day old (“Day 1”, n=11) and 7-9 day old (“Day 7-9”, n=10) R58H05-Gal4>CaLexA flies. (H) Relative GFP signal in R2 EB and FB for 1 day old (“Day 1”, n=15) and 7-9 day old (“Day 7-9”, n=10) R30G03-Gal4>CaLexA flies. (I) Schematic of the different time points for real-time Ca2+ level measurements using myrGCaMP5G. (J) Representative images of GCaMP (upper panels) and tdTomato (lower panels) fluorescence intensity in the R2 ring of R69F08-Gal4>UAS-myrGCaMP5G, UAS-CD4-tdTomato flies at ZT0, ZT12, ZT24 and ZT24 after 12 hr sleep deprivation (ZT24 SD). Average projections of all the frames in the 1 min recording are shown. Scale bar denotes 20 μm. (K) Relative GCaMP fluorescence intensity in the R2 ring at ZT0 (n=18), ZT12 (n=15), ZT24 (n=17) and ZT24 SD (n=18). GCaMP fluorescence was normalized to the tdTomato fluorescence signal intensity. Simplified box plots are shown, where the line inside the box indicates the median, and the top and bottom represent 75% and 25%, respectively. (See also Figure S4)
Figure 6
Figure 6
Manipulating levels of intracellular Ca2+adjusts synaptic strength and amount of sleep drive. (A) Relative GCaMP fluorescence intensity in the R2 ring in R69F08-Gal4>UAS-GCaMP5G, R69F08-Gal4>UAS-IP3R-RNAi1, UAS-GCaMP5G, and R69F08-Gal4>UAS-IP3R-RNAi2, UASGCaMP5G flies. Cytosolic Ca2+ is increased in control animals after sleep deprivation (n=12 for both No SD and SD), and this increase is blocked in R69F08-Gal4>UAS-IP3R-RNAi1, UASGCaMP5G (n=15 for both No SD and SD) and R69F08-Gal4>UAS-IP3R-RNAi2, UASGCaMP5G (n=7 for both No SD and SD) animals. (B) Number and size of BRP puncta in the R2 ring in R69F08-Gal4>STaR; R69F08-Gal4>UASIP3R-RNAi1, STaR, and R69F08-Gal4>UAS-IP3R-RNAi2, STaR flies. Number and size of BRP puncta are increased in control animals after sleep deprivation (n=13 for No SD and n=13 for SD), and these increases are suppressed in R69F08-Gal4>UAS-IP3R-RNAi1, STaR (n=13 for No SD and n=10 for SD) and R69F08-Gal4>UAS-IP3R-RNAi2, STaR (n=9 for No SD and n=8 for SD) animals. (C) % sleep recovered during the first 6 hrs following mechanical sleep deprivation for R69F08-Gal4>wt (n=25), wt>UAS-IP3R-RNAi1, (n=33), R69F08-Gal4>UAS-IP3R-RNAi1 (n=27), wt>UAS-IP3R-RNAi2, UAS-dicer2 (n=24), and R69F08-Gal4>UAS-IP3R-RNAi2, UAS-dicer2 (n=20) flies. (D) Upper panel illustrates the paradigm used to elevate Ca2+ levels in R2 neurons. Lower panel shows the number and size of BRP puncta in the R2 rings from R69F08-Gal4>STaR (n=20) and R69F08-Gal4>UAS-dTrpA1, STaR (n=24) flies at ZT2 after a 32°C heat pulse from ZT0-ZT1. Simplified box plots are shown, where the line inside the box indicates the median, and the top and bottom represent 75% and 25%, respectively. (E) Sleep profile of wt>UAS-dTrpA1 flies (black circles, n=42) vs R69F08-Gal4>UAS-dTrpA1 (magenta squares, n=26). Sleep time was plotted in 1 hr bins. White and black bars indicate 12 hr light and dark periods, respectively. 1 hr dTrpA1 activation at 32°C is indicated by the yellow box. (F) Sleep amount during ZT1-ZT12 following 1 hr dTrpA1 activation. Data from wt>UAS-dTrpA1 (n=42), R69F08-Gal4>wt (n=26), R69F08-Gal4>UAS-dTrpA1 (n=31), R58H05-Gal4>wt (n=32), and R58H05-Gal4>UAS-dTrpA1 (n=40) flies are shown. Data for wt>UAS-dTrpA1 and R69F08-Gal4>UAS-dTrpA1 are from the same flies as in Figure 6E. Mean ± SEM is shown. (See also Figure S5)
Figure 7
Figure 7
NMDA receptor expression in the R2 circuit is required for sleep need-dependent plasticity and generation of homeostatic sleep drive. (A) Whole-mount brain immunostaining of R58H05-Gal4>UAS-IVS-Syn21-GFP-p10, R30G03-Gal4>UAS-IVS-Syn21-GFP-p10 and R58H05-DBD, R30G03-AD>UAS- IVS-Syn21-GFP-p10 animal with anti-GFP. Maximal intensity projection of the central brain is shown. (B) Representative RT-PCR for Repo, GFP, and actin from whole brain samples and R2 TRAP samples. For detecting Repo and actin, 30 cycles were used. For detecting GFP signal, 42 cycles were used. (C) Relative change in mRNA levels between sleep-deprived and non-sleep-deprived (no SD) animals from whole brain (cyan bars) or R2 TRAP (green bars) samples. Data from 12 different neural plasticity-related genes: creb2 (n=3), creb2b (n=3), dlg (n=3), homer (n=3), 14-3-3 (n=3), activin (n=3), staufen (n=3), CavT (n=3), CavD (n=3), Shal (n=3), Shaker (n=3), and dNR1 (n=4) are shown. (D) Number and size of BRP puncta in the R2 ring in R58H05-DBD, R30G03-AD>STaR, R58H05-DBD, R30G03-AD >UAS-dsNR1, STaR, and R58H05-DBD, R30G03-AD>UAS-dsNR2, STaR flies. Number and size of BRP puncta are increased in control animals after sleep deprivation (n=11 for No SD and n=11 for SD), and these increases are blocked in R58H05-DBD, R30G03-AD>UAS-dsNR1, STaR (n=12 for No SD and n=13 for SD) and R58H05-DBD, R30G03-AD>UAS-dsNR2, STaR (n=8 for both No SD and SD) animals. (E) % sleep recovered during the first 6 hrs following mechanical sleep deprivation for R69F08-Gal4>UAS-dicer2 (n=59), R69F08-Gal4>UAS-dsNR1, UAS-dicer2 (n=37) and R69F08-Gal4>UAS-dsNR2, UAS-dicer2 (n=34) flies. (F) Proposed model illustrating the encoding of sleep drive in R2 neurons. Following hours of sleep deprivation, R2 neurons exhibit an IP3R-dependent increase in cytosolic Ca2+ levels and a marked increase in NMDA receptor levels. These changes lead to both electrical potentiation of the R2 neurons, and increased synaptic strength of these neurons, as indicated by higher levels of BRP. Sleep drive is encoded by the persistently increased synaptic strength of the R2 circuit and is maintained for hours following restoration of sleep. (See also Figure S6)

Comment in

References

    1. Benington JH, Heller HC. Restoration of brain energy metabolism as the function of sleep. Prog. Neurobiol. 1995;45:347–360. - PubMed
    1. Berridge KC. Motivation concepts in behavioral neuroscience. Physiol. & Behav. 2004;81:179–209. - PubMed
    1. Berridge MJ. Neuronal calcium signaling. Neuron. 1998;21:13–26. - PubMed
    1. Borbely AA. A two process model of sleep regulation. Hum. Neurobiol. 1982;1:195–204. - PubMed
    1. Borst A, Helmstaedter M. Common circuit design in fly and mammalian motion vision. Nat. Neurosci. 2015;18:1067–1076. - PubMed

Publication types