. 2016 May 23:7:11660.
doi: 10.1038/ncomms11660.

Relative rate and location of intra-host HIV evolution to evade cellular immunity are predictable

Affiliations

Relative rate and location of intra-host HIV evolution to evade cellular immunity are predictable

John P Barton et al. Nat Commun. .

Abstract

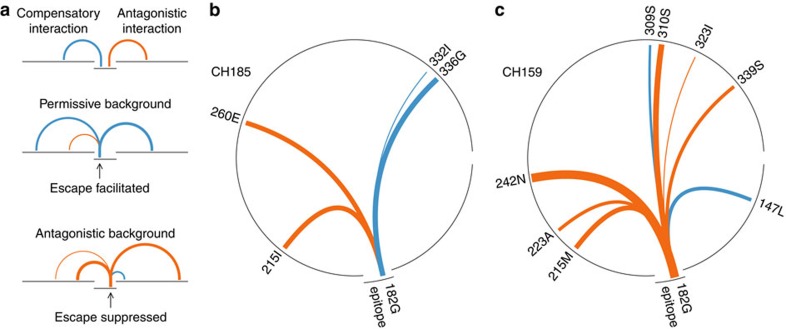
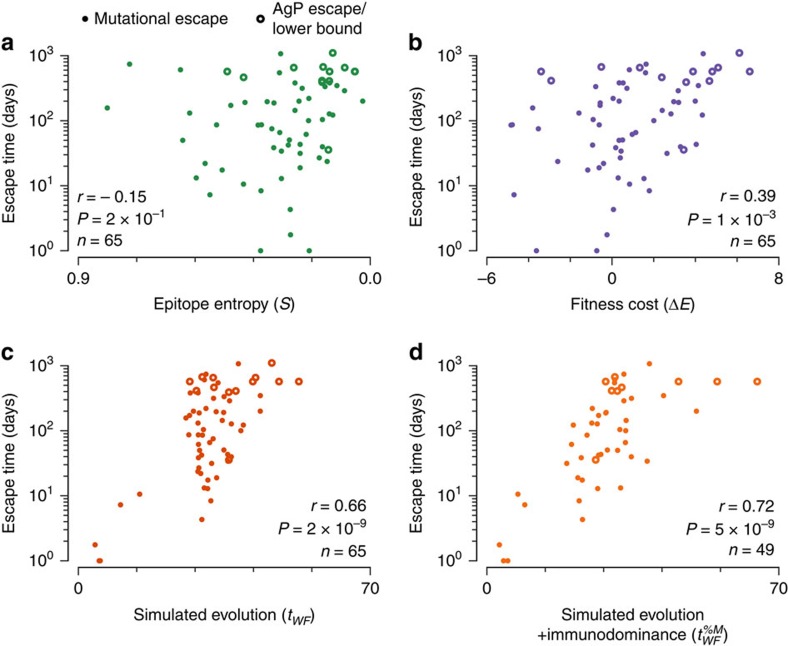
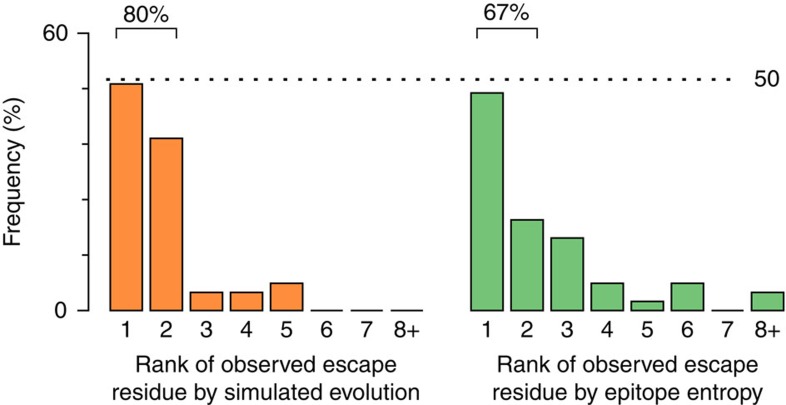
Human immunodeficiency virus (HIV) evolves within infected persons to escape being destroyed by the host immune system, thereby preventing effective immune control of infection. Here, we combine methods from evolutionary dynamics and statistical physics to simulate in vivo HIV sequence evolution, predicting the relative rate of escape and the location of escape mutations in response to T-cell-mediated immune pressure in a cohort of 17 persons with acute HIV infection. Predicted and clinically observed times to escape immune responses agree well, and we show that the mutational pathways to escape depend on the viral sequence background due to epistatic interactions. The ability to predict escape pathways and the duration over which control is maintained by specific immune responses open the door to rational design of immunotherapeutic strategies that might enable long-term control of HIV infection. Our approach enables intra-host evolution of a human pathogen to be predicted in a probabilistic framework.


Figures

Figure 1
Figure 1. Specific residues in the sequence background can strongly influence the time to escape.
(a) In general, escape may occur more rapidly on permissive sequence backgrounds having many compensatory interactions with potential escape mutations. Escape may also be delayed or can occur at other sites when strong antagonistic interactions increase the fitness cost of certain escape mutations. (b,c) Strong interactions between the Gag TL9 epitope escape mutation 182 G and the transmitted/founder sequence background in patients CH185 (b) (escape time=122 days) and CH159 (c) (escape time>1,103 days) differ significantly. All strong interactions (|J|>0.1, see equation (1)) between 182 G and the p24 protein sequence background, represented by the circles, are shown, with the width of the link proportional to the magnitude of the coupling. Compensatory or synergistic interactions (J>0) lower the fitness cost of mutation, thus promoting escape. Antagonistic interactions (J<0) increase the fitness cost of mutation, discouraging escape.
Figure 2
Figure 2. Measured escape times are strongly correlated with the simulated escape time.
Compared with the epitope entropy (a) and the average fitness cost of escape mutations (b), the time to escape in evolutionary simulation (c) shows more robust correlation with the escape time inferred from clinical data. When escape occurred through AgP mutations affecting presentation of the epitope (open circles), the time at which AgP mutants dominate the population is substituted as a lower bound for the escape time (n=3 cases). Similarly, the final time at which sequence samples were collected was substituted as a lower bound on the escape time when no escape was observed (n=10). (d) Information about immunodominance can be incorporated into evolutionary simulations, improving the predicted escape times for epitopes where this information is available (n=49). In all cases, epitopes where escape was observed at the time when T-cell response was detected are excluded (n=6 total, out of which 4 have immunodominance measurements). Epitopes studied include those derived from all HIV proteins except Vpu (because no patients targeted epitopes in Vpu early in infection) and gp120.
Figure 3
Figure 3. Simulation of evolution with the fitness landscape enhances prediction of the residues at which escape mutations occur.
In the great majority of epitopes (n=51), the most commonly observed location of escape mutations in the clinical data at the time that escape mutants first comprise >50% of the virus population corresponds to one of the two top residues where mutations are most frequently observed in simulated evolution (44/51=86%). For comparison, the residue where escape mutations are observed most often has one of the top two highest Shannon entropies in 34/51=67% of cases. Epitopes where escape was observed at the time the T-cell response was detected are excluded (n=6), as is one epitope without detailed escape sequence data.

References

    1. Phillips R. E. et al. Human immunodeficiency virus genetic variation that can escape cytotoxic T cell recognition. Nature 354, 453–459 (1991). - PubMed
    1. McMichael A. J., Borrow P., Tomaras G. D., Goonetilleke N. & Haynes B. F. The immune response during acute HIV-1 infection: clues for vaccine development. Nat. Rev. Immunol. 10, 11–23 (2009). - PMC - PubMed
    1. Feeney M. E. et al. Immune escape precedes breakthrough human immunodeficiency virus type 1 Viremia and broadening of the cytotoxic T-lymphocyte response in an HLA-B27-positive long-term-nonprogressing child. J. Virol. 78, 8927–8930 (2004). - PMC - PubMed
    1. Allen T. M. et al. Selective escape from CD8+ T-cell responses represents a major driving force of human immunodeficiency virus type 1 (HIV-1) sequence diversity and reveals constraints on HIV-1 evolution. J. Virol. 79, 13239–13249 (2005). - PMC - PubMed
    1. Draenert R. et al. Constraints on HIV-1 evolution and immunodominance revealed in monozygotic adult twins infected with the same virus. J. Exp. Med. 203, 529–539 (2006). - PMC - PubMed

Publication types

Substances