

doi: 10.3390/s16050731.
Recognizing Physisorption and Chemisorption in Carbon Nanotubes Gas Sensors by Double Exponential Fitting of the Response
Affiliations
- PMID: 27213387
- PMCID: PMC4883422
- DOI: 10.3390/s16050731
Item in Clipboard
Recognizing Physisorption and Chemisorption in Carbon Nanotubes Gas Sensors by Double Exponential Fitting of the Response
Sensors (Basel).
.
Abstract
Multi-walled carbon nanotubes (CNTs) have been grown in situ on a SiO 2 substrate and used as gas sensors. For this purpose, the voltage response of the CNTs as a function of time has been used to detect H 2 and CO 2 at various concentrations by supplying a constant current to the system. The analysis of both adsorptions and desorptions curves has revealed two different exponential behaviours for each curve. The study of the characteristic times, obtained from the fitting of the data, has allowed us to identify separately chemisorption and physisorption processes on the CNTs.
Keywords: CNTs sensors; chemisorption; physisorption.
Figures

(Left) A Scanning Electron Microscope (SEM) image from the vertically aligned grown samples; (Right) Particular of the tips from the grown nanotubes. From this image it is clear that the natotubes twine at the tips. The diameter of the carbon nanotubes (CNTs) can be estimated to be around 10 nm.
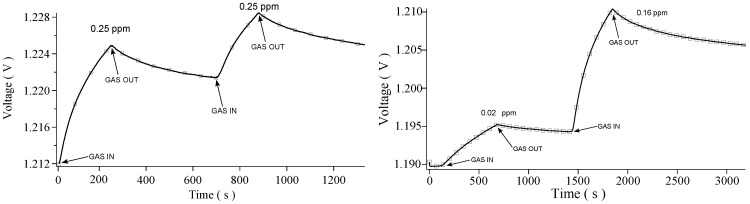
Typical set of voltage vs time data. The response can be also seen as variations in measured resistivity. Measured data for the hydrogen case. (Left) Exposure to 0.25 ppm; (Right) Exposure to 0.02 and 0.16 ppm.

Single exponential fit for the measured curves for hydrogen at 0.16 ppm. (Left) Ascent curve; (Right) Descent curve.

(Left) Dispersion plot showing decreasing response times as function of increasing gas concentrations; (Right) Decomposition of desorption process in terms of the model used (see text).

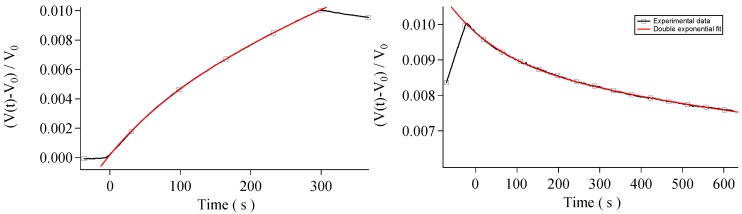
Double exponential fit for hydrogen. As it can be seen, a better agreement is reached with respect to single exponential fit. (Left) Ascent curve; (Right) Descent curve.
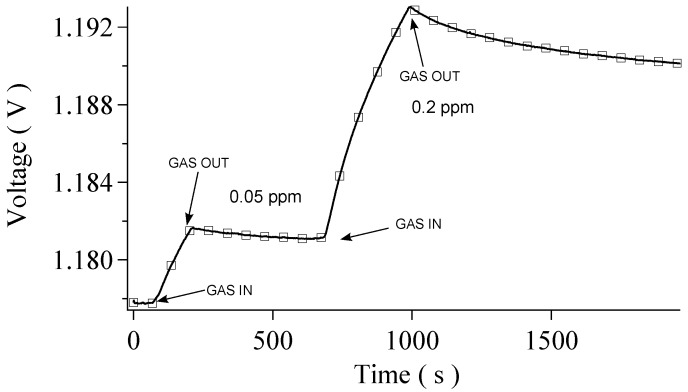
Set of data for the case. Data show the response of the sensor for gas concentrations of 0.05 ppm and 0.20 ppm.
Double exponential fit for carbon dioxide. (Left) Ascent curve; (Right) Descent curve.
References
-
- Wang Y., Yeow J.T. A review of carbon nanotubes-based gas sensors. J. Sens. 2009;2009:1–24. doi: 10.1155/2009/493904. - DOI
LinkOut - more resources
Full Text Sources
Other Literature Sources
