. 2016 May 19;8(5):304.
doi: 10.3390/nu8050304.

The Effect of Gestational and Lactational Age on the Human Milk Metabolome

Affiliations

The Effect of Gestational and Lactational Age on the Human Milk Metabolome

Ulrik K Sundekilde et al. Nutrients. .

Abstract

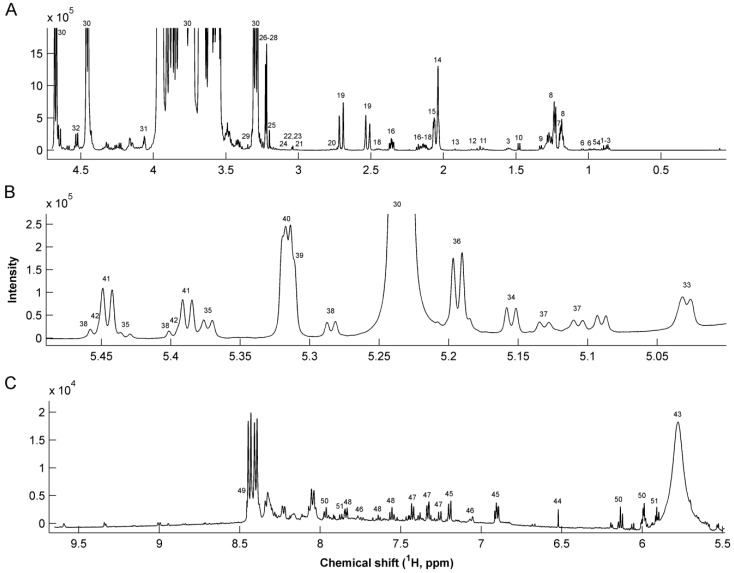
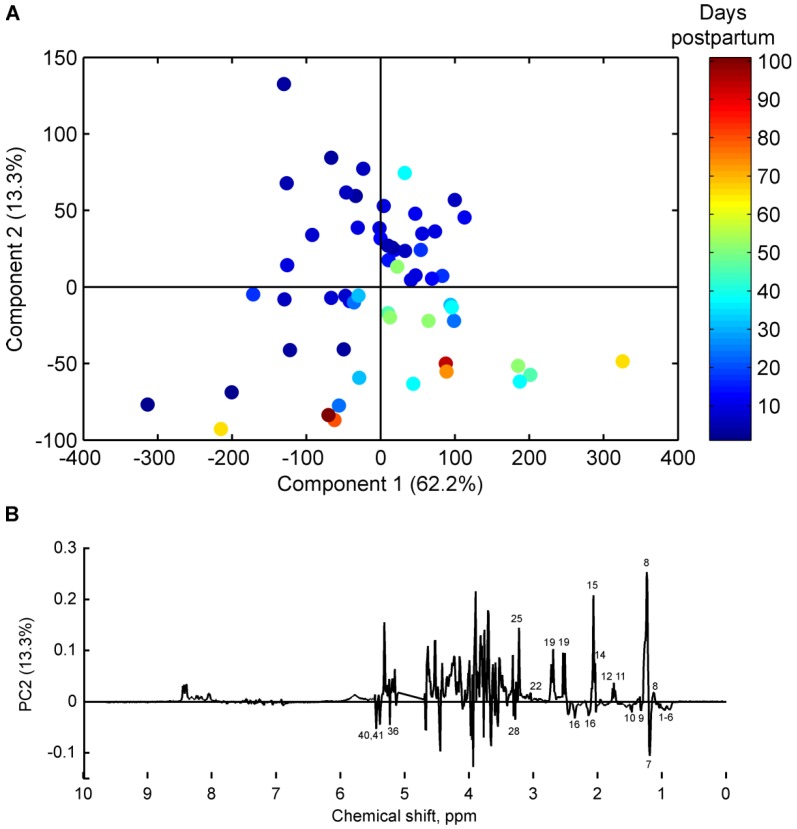
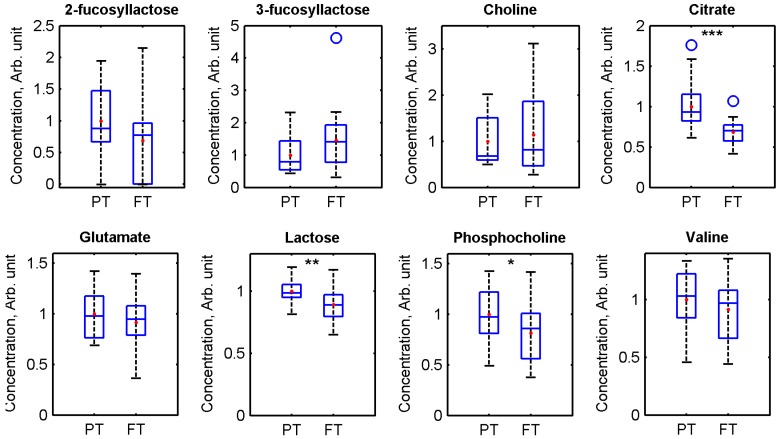
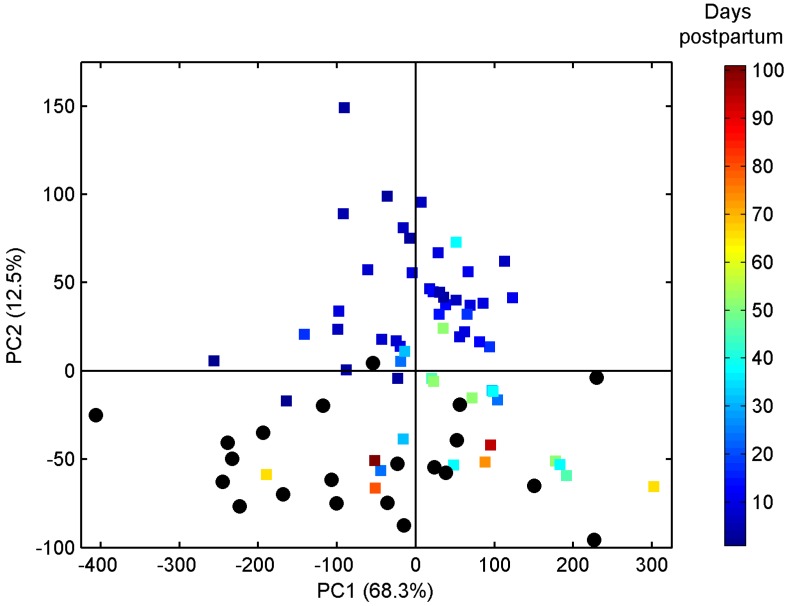
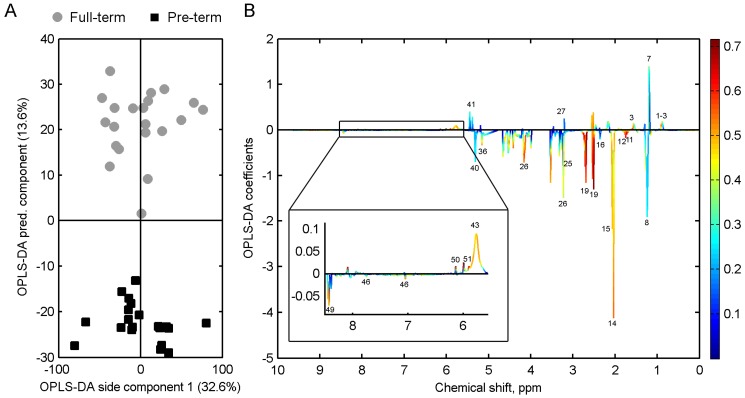
Human milk is the ideal nutrition source for healthy infants during the first six months of life and a detailed characterisation of the composition of milk from mothers that deliver prematurely (<37 weeks gestation), and of how human milk changes during lactation, would benefit our understanding of the nutritional requirements of premature infants. Individual milk samples from mothers delivering prematurely and at term were collected. The human milk metabolome, established by nuclear magnetic resonance (NMR) spectroscopy, was influenced by gestational and lactation age. Metabolite profiling identified that levels of valine, leucine, betaine, and creatinine were increased in colostrum from term mothers compared with mature milk, while those of glutamate, caprylate, and caprate were increased in mature term milk compared with colostrum. Levels of oligosaccharides, citrate, and creatinine were increased in pre-term colostrum, while those of caprylate, caprate, valine, leucine, glutamate, and pantothenate increased with time postpartum. There were differences between pre-term and full-term milk in the levels of carnitine, caprylate, caprate, pantothenate, urea, lactose, oligosaccharides, citrate, phosphocholine, choline, and formate. These findings suggest that the metabolome of pre-term milk changes within 5-7 weeks postpartum to resemble that of term milk, independent of time of gestation at pre-mature delivery.

Keywords: NMR; human milk; infant; metabolites; metabolomics; nutrition; pre-term.


Figures

Figure 1
Figure 1
Median 1H NMR spectrum of 92 human milk samples. (A) Aliphatic region 4.6–0 ppm (B) Human milk oligosaccharides in 5.45–5.00 ppm region; and (C) aromatic region 9.7–5.5 ppm region. For peak assignments refer to Table 3.
Figure 2
Figure 2
(A) Principal component analysis scores plot of full-term milk samples from 30 mothers (n = 30)); samples are coloured according to days postpartum; Colostrum (dots), transitional (squares), and mature (triangles); the circle denotes samples from non-secretor mothers, while remaining samples are from secretor mothers; and (B) corresponding loading line plots. For peak assignments refer to Table 3.
Figure 3
Figure 3
(A) Principal component analysis scores plot of pre-term milk samples from 15 mothers (n = 58), coloured according to number of days postpartum; and (B) corresponding loading line plot. For peak assignments refer to Table 3.
Figure 4
Figure 4
Box plots showing the distributions of 2-fucosyllactose, 3-fucosyllactose, choline, citrate, glutamate, lactose, phosphocholine, and valine concentrations in pre-term (PT) and full-term (FT) milk. Pre-term milk samples <14 days postpartum and full-term colostrum, transitional, and mature >26 weeks were excluded from the analysis in order to compare milk with a similar range of days postpartum. Horizontal lines indicate medians; coloured boxes specify interquartile ranges and dashed lines the ranges without outliers. The open circles indicate outliers (falls in-between 1.5× and 3× the interquartile range). *** = P < 0.001, ** = P < 0.01, * = P < 0.05; the comparisons were made using two-tailed Student’s t-test.
Figure 5
Figure 5
Principal component analysis scores plot of mature milk samples from pre-term (squares, n = 58) and full-term (circles, n = 30) mothers. Pre-term milk samples are coloured according to days postpartum.
Figure 6
Figure 6
(A) Orthogonal partial least squares discriminant analysis of pre-term (n = 20, days postpartum range 3–14 weeks) and full-term (n = 21, days postpartum range 3–26 weeks) milk. Full-term colostrum, transitional, and pre-term milk <2 weeks postpartum have been excluded. Cross-validation, Q2: 0.70; (B) corresponding OPLS-DA coefficients plot. Each variable has been coloured according to the OPLS-DA loadings (correlation between NMR variables and pre-term/full-term classes); for peak assignments refer to Table 3.

References

    1. Wu T.C., Chen P.H. Health consequences of nutrition in childhood and early infancy. Pediatr. Neonatol. 2009;50:135–142. doi: 10.1016/S1875-9572(09)60051-6. - DOI - PubMed
    1. Da Costa T.H.M., Haisma H., Wells J.C.K., Mander A.P., Whitehead R.G., Bluck L.J.C. How much human milk do infants consume? Data from 12 countries using a standardized stable isotope methodology. J. Nutr. 2010;140:2227–2232. - PMC - PubMed
    1. Isaacs E.B., Morley R., Lucas A. Early diet and general cognitive outcome at adolescence in children born at or below 30 weeks gestation. J. Pediatr. 2009;155:229–234. doi: 10.1016/j.jpeds.2009.02.030. - DOI - PubMed
    1. Lawrence R.M. Breastfeeding, Host-resistance factors and immunologic significance of human milk. In: Lawrence R.A., Lawrence R.M., editors. Breastfeeding. A guide for the medical profession. Elsevier; Philadelphia, PA, USA: 2006. pp. 171–214.
    1. Sullivan S., Schanler R.J., Kim J.H., Patel A.L., Trawöger R., Kiechl-Kohlendorfer U., Chan G.M., Blanco C.L., Abrams S., Cotten C.M., et al. An exclusively human milk-based diet is associated with a lower rate of necrotizing enterocolitis than a diet of human milk and bovine milk-based products. J. Pediatr. 2010;156:562–567. doi: 10.1016/j.jpeds.2009.10.040. - DOI - PubMed

LinkOut - more resources