Case Reports
. 2016 May 23;11(5):e0155561.
doi: 10.1371/journal.pone.0155561. eCollection 2016.

Establishment of a Conditionally Immortalized Wilms Tumor Cell Line with a Homozygous WT1 Deletion within a Heterozygous 11p13 Deletion and UPD Limited to 11p15

Affiliations
Case Reports

Establishment of a Conditionally Immortalized Wilms Tumor Cell Line with a Homozygous WT1 Deletion within a Heterozygous 11p13 Deletion and UPD Limited to 11p15

Artur Brandt et al. PLoS One. .

Abstract

We describe a stromal predominant Wilms tumor with focal anaplasia and a complex, tumor specific chromosome 11 aberration: a homozygous deletion of the entire WT1 gene within a heterozygous 11p13 deletion and an additional region of uniparental disomy (UPD) limited to 11p15.5-p15.2 including the IGF2 gene. The tumor carried a heterozygous p.T41A mutation in CTNNB1. Cells established from the tumor carried the same chromosome 11 aberration, but a different, homozygous p.S45Δ CTNNB1 mutation. Uniparental disomy (UPD) 3p21.3pter lead to the homozygous CTNNB1 mutation. The tumor cell line was immortalized using the catalytic subunit of human telomerase (hTERT) in conjunction with a novel thermolabile mutant (U19dl89-97tsA58) of SV40 large T antigen (LT). This cell line is cytogenetically stable and can be grown indefinitely representing a valuable tool to study the effect of a complete lack of WT1 in tumor cells. The origin/fate of Wilms tumors with WT1 mutations is currently poorly defined. Here we studied the expression of several genes expressed in early kidney development, e.g. FOXD1, PAX3, SIX1, OSR1, OSR2 and MEIS1 and show that these are expressed at similar levels in the parental and the immortalized Wilms10 cells. In addition the limited potential for muscle/ osteogenic/ adipogenic differentiation similar to all other WT1 mutant cell lines is also observed in the Wilms10 tumor cell line and this is retained in the immortalized cells. In summary these Wilms10 cells are a valuable model system for functional studies of WT1 mutant cells.


Conflict of interest statement

Competing Interests: The authors have declared that no competing interests exist.

Figures

Fig 1
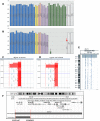
Fig 1. Characterization of the chromosome 11p13 alteration in tumor and tumor cell culture DNA from patient Wilms10.
(A) Multiplex ligation-dependent probe amplification analysis (MLPA) of blood DNA. Green peaks are derived from WT1 exons, white peaks represent genes proximal of WT1 in 11p13, purple peaks correspond to PAX6 and pale pink peaks to BDNF exons, distal of WT1 in 11p13. The yellow peaks represent 11p15 markers and blue peaks are controls from different chromosomes. (B) In DNA isolated from the primary Wilms10 tumor; only one small peak from exon 10 of WT1 is observed, whereas all other products from WT1 are missing entirely. A red arrows indicates the reduced peak from the HIPK3 gene. (C) aSNP/aCGH data of the 11p13 region from the primary Wilms tumor and (D) from the tumor derived cell culture. The homozygous deletion covering the WT1 gene is clearly visible with log ratio of -4. (E) UPD limited to 11p15 as shown with the cytogenomics workbench program. (F) Summary of the genomic alterations in 11p13 with the positions of the heterozygous and homozygous deletions.
Fig 2
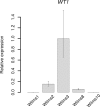
Fig 2. Quantitative RT-PCR analysis of the WT1 expression in various WT cell lines.
Total RNA from the WT1 mutant cell lines Wilms1, Wilms2, Wilms3, Wilms8 and Wilms10 was analyzed by Q-RT-PCR. The genetic alterations present in these cell lines are found in S1 Table. The expression level was normalized versus RER1, a gene with the lowest variation between the cell lines in our gene expression studies. The analysis was performed in triplicates. The error bars correspond to 95% confidence intervals. The relative expression is shown versus Wilms3.
Fig 3
Fig 3. Comparison of CTNNB1 mutations and UPD region on chromosome 3 in the primary Wilms10 tumor and tumor-derived cells.
(A) DNA sequencing reveals a heterozygous A>G CTNNB1 mutation at position c.121/p.T41A in the primary Wilms10 tumor. The position of the three deleted nucleoties in the tumor cells culture are boxed. (B) identification of a homozygous deletion c.133_135del TCT (p.S45Δ) in the CTNNB1 gene in the Wilms10 tumor-derived cell line. The position of this deletion is indicated above the DNA sequence. (C) UPD region on chromosome 3p as shown with the cytogenomics workbench program.
Fig 4
Fig 4. Similar expression level of selected kidney marker genes in imWilms10 and Wilms10 cells.
The selection of these genes was based on studies of gene expression in various compartments during kidney development. All of these genes are also expressed in the other WT1 mutant cell lines that we have previously established. The data are derived from microarray analyses of two biological replicates. The expression level is indicated from microarray intensity and the bar represents standard error.
Fig 5
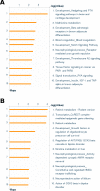
Fig 5. Comparison of gene expression of the imWilms10 cells cultured at 33° C with non immortalized Wilms10 cells.
The data set of differentially expressed genes was analyzed with the MetaCore algorithm "pathway analysis" to identify significantly enriched pathways. In this analysis the differentially expressed gene set of up- and down-regulated genes were analyzed separately (FDR adjusted p-value of 0.1). (A) the top 10 enriched pathways for down-regulated genes. The log P-values are indicated above the list. (B) the top 10 enriched pathways for up-regulated genes.
Fig 6
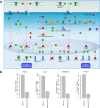
Fig 6. The top pathway down-regulated in imWilms10 versus non immortalized Wilms10 cells.
(A) Using a gene set derived from the stringent parameters (FDR adjusted p-value of 0.1) the top down-regulated pathway in imWilms10 is Development_Hedgehog and PTH signalling pathways in bone and cartilage development". Down-regulated genes from this pathway are labelled with a thermometer. The height of the blue colour in the thermometer shows the fold down-regulation in the immortalized cells. (B) shown is the down-regulation of the four genes mapping to this pathway by expression intensity on the biological replicates on the arrays.
Fig 7
Fig 7. Down-regulation of the two embryonal growth factors IFG2 and MEST.
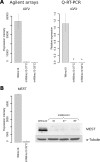
(A) Down-regulation of IGF2 in imWilms10 cells cultured at 33°C as seen in two biological replicates on the Agilent array (left). The down-regulation was confirmed by Q-RT-PCR and is seen when cells are cultured at 33° and 37°C (right). The error bars correspond to 95% confidence intervals and * corresponds to a significance level of p 0.000001. (B) Down-regulation of MEST RNA as seen in the two biological replicates (left) and the confirmation of the protein down-regulation by western blot analysis. The down-regulation is seen at all temperatures, even at 39°C, the nonpermissive temperature for the tsLT, indicating that it is due to hTERT expression and is independent on the functional LT.
Fig 8
Fig 8. Human Phospho-RTK array blot and down-regulation of PDGFRA and PDGFRB genes.
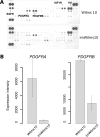
(A) Protein extracts from Wilms10 and imWilms10 cells cultured at 33°C were analyzed for the phosphorylation status of 49 receptors using the ProteomeProfilerTM Phospho-RTK Array kit. Each receptor is spotted in duplicates. The top blot represents protein analysis of parental Wilms10 cells and the position for the highly phosphorylated receptors are labelled with their names. Below, the analysis of protein extracts from the imWilms10 cells. A reduction in the phosphorylation IGF-1R, PDGFRA and PDGFRB receptors is seen, whereas Axl and EGFR remain unchanged. The strong signals in the left top row, right top row and bottom left row are positive control spots, indicating that the same amount of protein extracts were analyzed. (B) Expression intensity of PDGFRA and PDGFRB genes in Wilms10 cells and imWilms10 cultured at 33°C. The error bar represents the standard error derived from the two biological replicates on the array.
Fig 9
Fig 9. Differentiation potential of Wilms10 and imWilms10 cell lines.
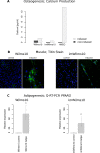
(A) Analysis of osteogenesis as measured by quantification of calcium production. Parental Wilms10 cells deposit some calcium in the absence of induction conditions. hMSC cells were used as controls and they show a high level of calcium production after induction of differentiation. The imWilms10 cells, demonstrate a modest increase of calcium production as compared to parental Wilms10 cells. (B) Analysis of muscle differentiation by immunofluorescence analysis using a Titin antibody. Left: Most Wilms10 cells show positive staining for Titin after 9 days of induction. Right: the same analysis was performed with imWilms10 cells. A lower percentage of cells showed a positive staining for Titin. (C) Quantitative analysis PPARG mRNA expression, as a marker for adipogenesis. Left: After 10 days of induction a significant increase is seen in Wiilms10 cells compared to the uninduced control. The expression was normalized versus RER1 and the analysis was done in triplicates. The error bar corresponds to 95% confidence intervals and * corresponds to a significance level of p = 0.00001- Right: The same analysis was conducted with imWilms10 cells and a slightly lower induction was observed when compared to uninduced control cells. Expression analysis was done after 18 days of induction of imWilms10 cells. The error bar corresponds to 95% confidence intervals and * corresponds to a significance level of p = 0.00001.

Similar articles

Cited by

References

    1. Schumacher V, Schneider S, Figge A, Wildhardt G, Harms D, Schmidt D, et al. (1997) Correlation of germ-line mutations and two-hit inactivation of the WT1 gene with Wilms tumors of stromal-predominant histology. Proc Natl Acad Sci USA 94: 3972–3977. - PMC - PubMed
    1. Maiti S, Alam R, Amos CI, Huff V. (2000) Frequent association of β-catenin and WT1 mutations in Wilms tumors. Cancer Res 60: 6288–6292. - PubMed
    1. Schumacher V, Schuhen S, Sonner S, Weirich A, Leuschner I, Harms D, et al. (2003) Two molecular subgroups of Wilms' tumors with or without WT1 mutations. Clin Cancer Res 9: 2005–2014. - PubMed
    1. Little SE, Hanks SP, Kind-Underwood L, Jones C, Rapley EA, Rahman N, et al. (2004) Frequency and heritability of WT1 mutations in nonsyndromic Wilms’ tumor patients: A UK Children’s Cancer Study Group Study. J Clin Oncol 22: 4140–4146. - PubMed
    1. Royer-Pokora B, Weirich A, Schumacher V, Uschkereit C, Beier M, Leuschner I, et al. (2008) Clinical relevance of mutations in the Wilms tumor suppressor 1 gene WT1 and the cadherin-associated protein beta1 gene CTNNB1 for patients with Wilms tumors: results of long-term surveillance of 71 patients from International Society of Pediatric Oncology Study 9/Society for Pediatric Oncology Cancer 5: 1080–1089. - PubMed

Publication types

Supplementary concepts