

Near-Bottom Hypoxia Impacts Dynamics of Bacterioplankton Assemblage throughout Water Column of the Gulf of Finland (Baltic Sea)
- PMID: 27213812
- PMCID: PMC4877108
- DOI: 10.1371/journal.pone.0156147
Near-Bottom Hypoxia Impacts Dynamics of Bacterioplankton Assemblage throughout Water Column of the Gulf of Finland (Baltic Sea)
Abstract
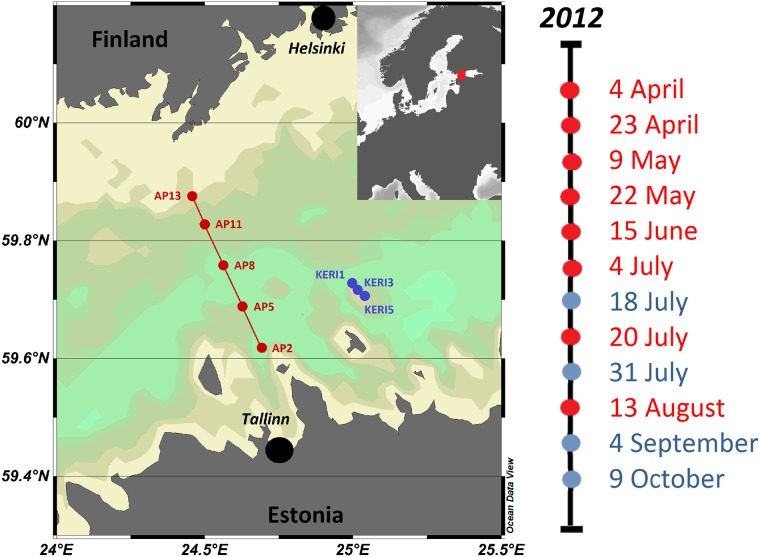
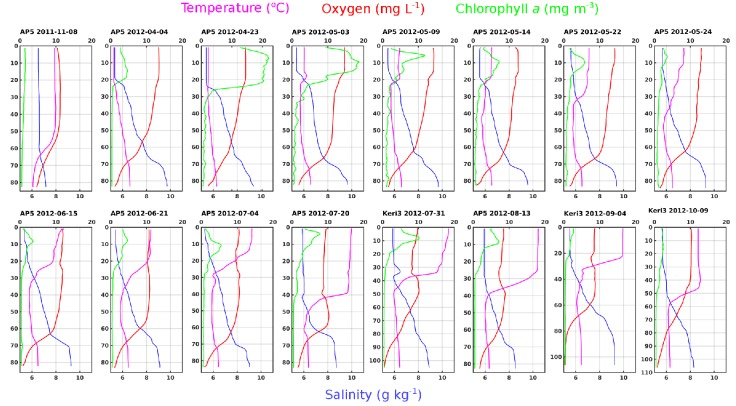
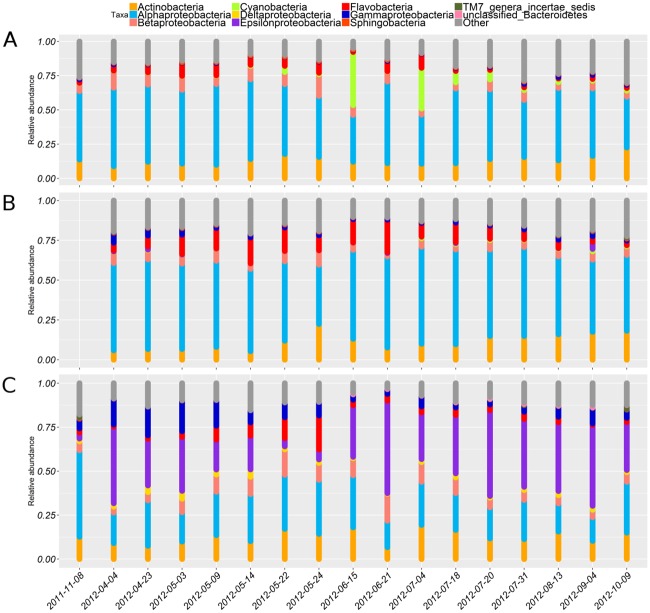
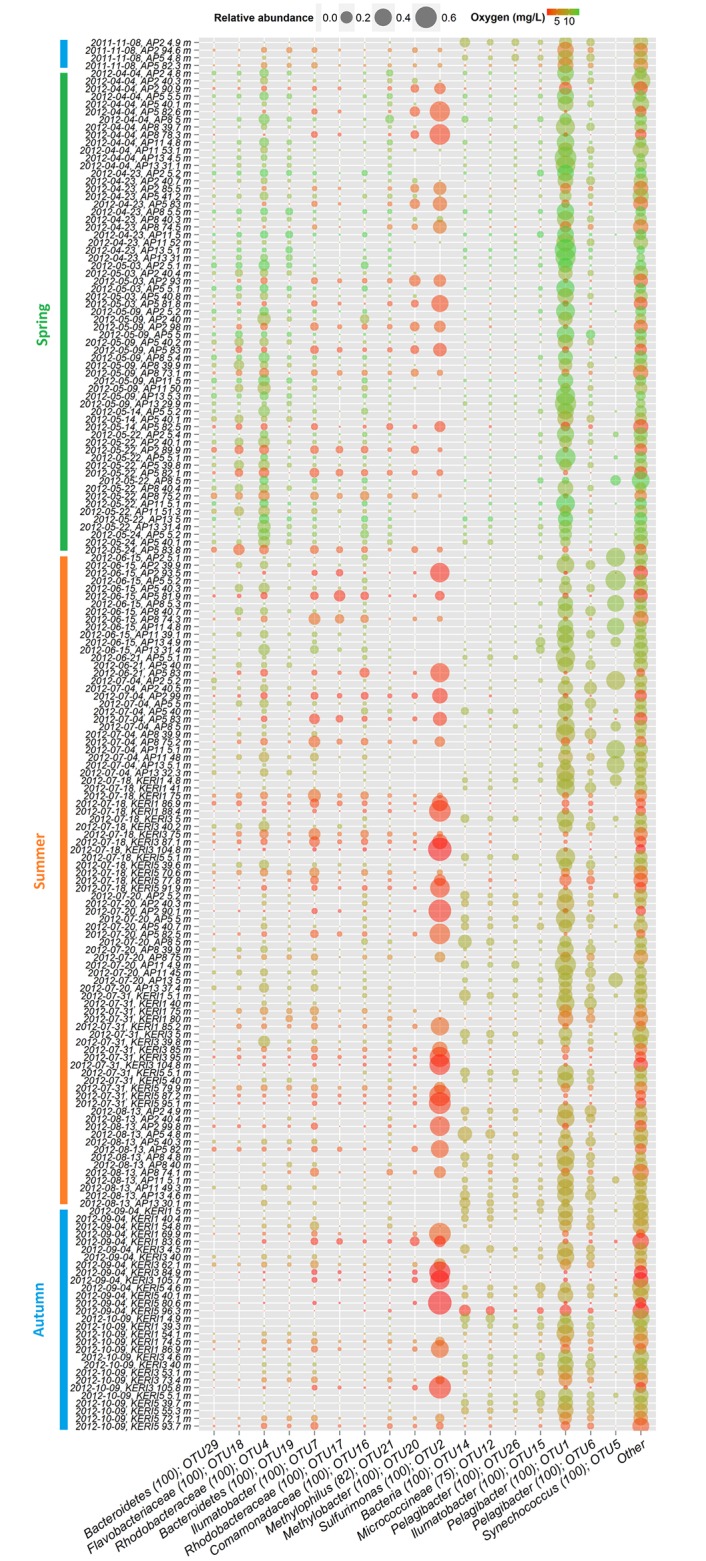
Over the past century the spread of hypoxia in the Baltic Sea has been drastic, reaching its 'arm' into the easternmost sub-basin, the Gulf of Finland. The hydrographic and climatological properties of the gulf offer a broad suite of discrete niches for microbial communities. The current study explores spatiotemporal dynamics of bacterioplankton community in the Gulf of Finland using massively parallel sequencing of 16S rRNA fragments obtained by amplifying community DNA from spring to autumn period. The presence of redoxcline and drastic seasonal changes make spatiotemporal dynamics of bacterioplankton community composition (BCC) and abundances in such estuary remarkably complex. To the best of our knowledge, this is the first study that analyses spatiotemporal dynamics of BCC in relation to phytoplankton bloom throughout the water column (and redoxcline), not only at the surface layer. We conclude that capability to survive (or benefit from) shifts between oxic and hypoxic conditions is vital adaptation for bacteria to thrive in such environments. Our results contribute to the understanding of emerging patterns in BCCs that occupy hydrographically similar estuaries dispersed all over the world, and we suggest the presence of a global redox- and salinity-driven metacommunity. These results have important implications for understanding long-term ecological and biogeochemical impacts of hypoxia expansion in the Baltic Sea (and similar ecosystems), as well as global biogeography of bacteria specialized inhabiting similar ecosystems.
Conflict of interest statement
Figures
Similar articles
-
Redox-specialized bacterioplankton metacommunity in a temperate estuary.PLoS One. 2015 Apr 10;10(4):e0122304. doi: 10.1371/journal.pone.0122304. eCollection 2015. PLoS One. 2015. PMID: 25860812 Free PMC article.
-
Microbial ecology of northern Gulf of Mexico estuarine waters.mSystems. 2024 Aug 20;9(8):e0131823. doi: 10.1128/msystems.01318-23. Epub 2024 Jul 9. mSystems. 2024. PMID: 38980056 Free PMC article.
-
The native bacterioplankton community in the central baltic sea is influenced by freshwater bacterial species.Appl Environ Microbiol. 2008 Jan;74(2):503-15. doi: 10.1128/AEM.01983-07. Epub 2007 Nov 26. Appl Environ Microbiol. 2008. PMID: 18039821 Free PMC article.
-
Marine Bacterioplankton Seasonal Succession Dynamics.Trends Microbiol. 2017 Jun;25(6):494-505. doi: 10.1016/j.tim.2016.12.013. Epub 2017 Jan 17. Trends Microbiol. 2017. PMID: 28108182 Review.
-
Microbial ecology of deep-sea hypersaline anoxic basins.FEMS Microbiol Ecol. 2018 Jul 1;94(7). doi: 10.1093/femsec/fiy085. FEMS Microbiol Ecol. 2018. PMID: 29905791 Review.
Cited by
-
Abundant and persistent sulfur-oxidizing microbial populations are responsive to hypoxia in the Chesapeake Bay.Environ Microbiol. 2022 May;24(5):2315-2332. doi: 10.1111/1462-2920.15976. Epub 2022 Mar 19. Environ Microbiol. 2022. PMID: 35304940 Free PMC article.
-
Sulfurimonas subgroup GD17 cells accumulate polyphosphate under fluctuating redox conditions in the Baltic Sea: possible implications for their ecology.ISME J. 2019 Feb;13(2):482-493. doi: 10.1038/s41396-018-0267-x. Epub 2018 Oct 5. ISME J. 2019. PMID: 30291329 Free PMC article.
-
Spring and Late Summer Phytoplankton Biomass Impact on the Coastal Sediment Microbial Community Structure.Microb Ecol. 2019 Feb;77(2):288-303. doi: 10.1007/s00248-018-1229-6. Epub 2018 Jul 17. Microb Ecol. 2019. PMID: 30019110 Free PMC article.
-
Comparison of bacterial community structure and potential functions in hypoxic and non-hypoxic zones of the Changjiang Estuary.PLoS One. 2019 Jun 6;14(6):e0217431. doi: 10.1371/journal.pone.0217431. eCollection 2019. PLoS One. 2019. PMID: 31170168 Free PMC article.
References
-
- Karlson K, Rosenberg R, Bonsdorff E. Temporal and spatial large-scale effects of eutrophication and oxygen deficiency on benthic fauna in Scandinavian and Baltic waters: a review. Oceanography and Marine Biology. 2002;40:427–89.
Publication types
MeSH terms
Substances
LinkOut - more resources
Full Text Sources
Other Literature Sources
Miscellaneous
