

Muscle Biopsy Findings in Combination With Myositis-Specific Autoantibodies Aid Prediction of Outcomes in Juvenile Dermatomyositis
- PMID: 27214289
- PMCID: PMC5091622
- DOI: 10.1002/art.39753
Muscle Biopsy Findings in Combination With Myositis-Specific Autoantibodies Aid Prediction of Outcomes in Juvenile Dermatomyositis
Abstract
Objective: Juvenile dermatomyositis (DM) is a rare and severe autoimmune condition characterized by rash and proximal muscle weakness. While some patients respond to standard treatment, others do not. This study was carried out to investigate whether histopathologic findings and myositis-specific autoantibodies (MSAs) have prognostic significance in juvenile DM.
Methods: Muscle biopsy samples (n = 101) from patients in the UK Juvenile Dermatomyositis Cohort and Biomarker Study were stained, analyzed, and scored for severity of histopathologic features. In addition, autoantibodies were measured in the serum or plasma of patients (n = 90) and longitudinal clinical data were collected (median duration of follow-up 4.9 years). Long-term treatment status (on or off medication over time) was modeled using generalized estimating equations.
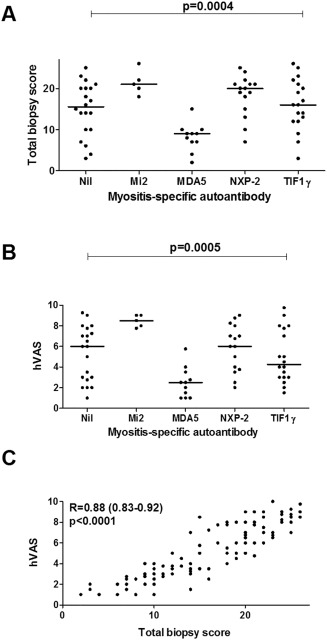
Results: Muscle biopsy scores differed according to MSA subgroup. When the effects of MSA subgroup were accounted for, increased severity of muscle histopathologic features was predictive of an increased risk of remaining on treatment over time: for the global pathology score (histopathologist's visual analog scale [hVAS] score), 1.48-fold higher odds (95% confidence interval [95% CI] 1.12-1.96; P = 0.0058), and for the total biopsy score (determined with the standardized score tool), 1.10-fold higher odds (95% CI 1.01-1.21; P = 0.038). A protective effect was identified in patients with anti-Mi-2 autoantibodies, in whom the odds of remaining on treatment were 7.06-fold lower (95% CI 1.41-35.36; P = 0.018) despite muscle biopsy scores indicating more severe disease. In patients with anti-nuclear matrix protein 2 autoantibodies, anti-transcription intermediary factor 1γ autoantibodies, or no detectable autoantibody, increased histopathologic severity alone, without adjustment for the effect of MSA subtype, was predictive of the risk of remaining on treatment: for the hVAS global pathology score, 1.61-fold higher odds (95% CI 1.16-2.22; P = 0.004), and for the total biopsy score, 1.13-fold higher odds (95% CI 1.03-1.24; P = 0.013).
Conclusion: Histopathologic severity, in combination with MSA subtype, is predictive of the risk of remaining on treatment in patients with juvenile DM and may be useful for discussing probable treatment length with parents and patients. Understanding these associations may identify patients at greater risk of severe disease.
© 2016 The Authors. Arthritis & Rheumatology published by Wiley Periodicals, Inc. on behalf of the American College of Rheumatology.
Figures


Comment in
-
Inflammatory myopathies: Muscle pathology helps predict JDM outcomes.Nat Rev Rheumatol. 2016 Jul;12(7):374-5. doi: 10.1038/nrrheum.2016.97. Epub 2016 Jun 9. Nat Rev Rheumatol. 2016. PMID: 27278124 No abstract available.
References
-
- Sanner H, Sjaastad I, Flatø B. Disease activity and prognostic factors in juvenile dermatomyositis: a long‐term follow‐up study applying the Paediatric Rheumatology International Trials Organization criteria for inactive disease and the myositis disease activity assessment tool. Rheumatology (Oxford) 2014;53:1578–85. - PubMed
-
- Martin N, Krol P, Smith S, Murray K, Pilkington CA, Davidson JE, et al. A national registry for juvenile dermatomyositis and other paediatric idiopathic inflammatory myopathies: 10 years' experience; the Juvenile Dermatomyositis National (UK and Ireland) Cohort Biomarker Study and Repository for Idiopathic Inflammatory Myopathies. Rheumatology (Oxford) 2011;50:137–45. - PMC - PubMed
-
- Lega JC, Fabien N, Reynaud Q, Durieu I, Durupt S, Dutertre M, et al. The clinical phenotype associated with myositis‐specific and associated autoantibodies: a meta‐analysis revisiting the so‐called antisynthetase syndrome. Autoimmun Rev 2014;13:883–91. - PubMed
MeSH terms
Substances
Grants and funding
LinkOut - more resources
Full Text Sources
Other Literature Sources
