. 2016 Jul 1;126(7):2465-81.
doi: 10.1172/JCI82925. Epub 2016 May 23.

Increased mitochondrial arginine metabolism supports bioenergetics in asthma

Increased mitochondrial arginine metabolism supports bioenergetics in asthma

Weiling Xu et al. J Clin Invest. .

Abstract

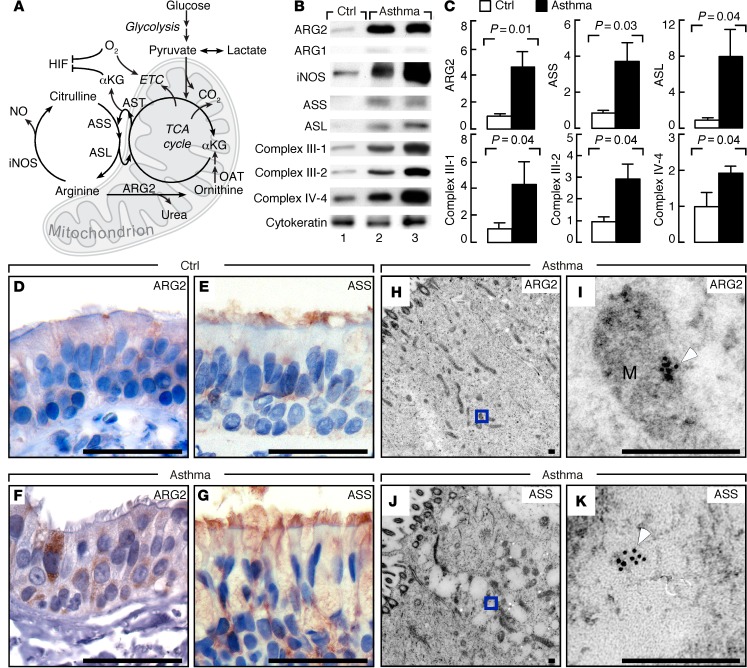
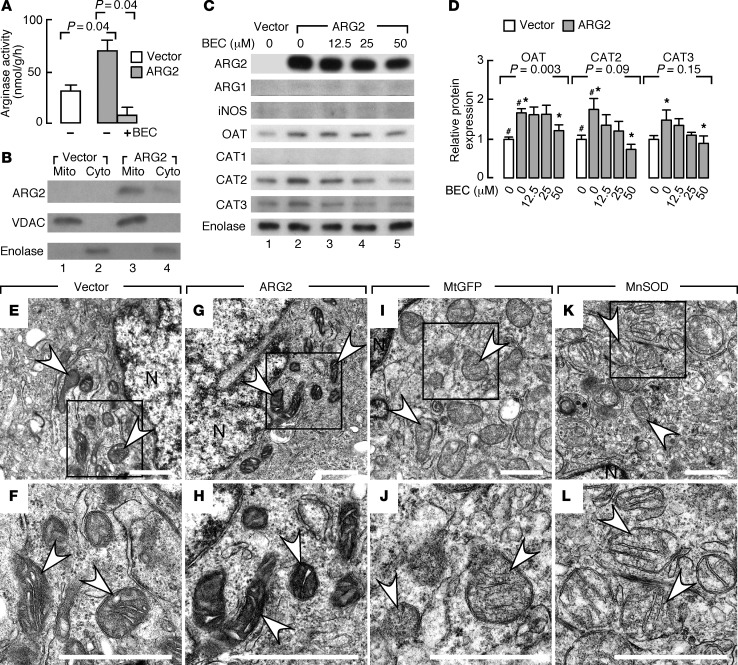
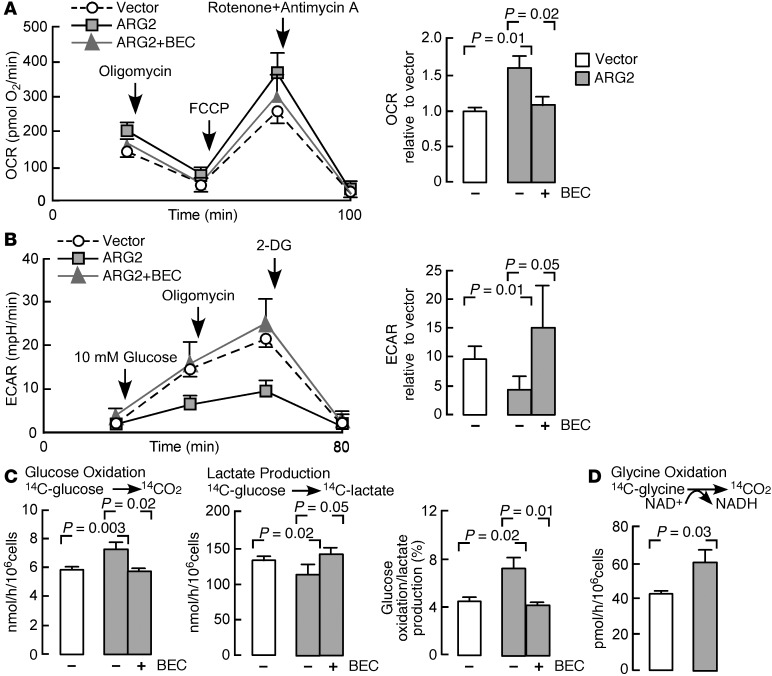
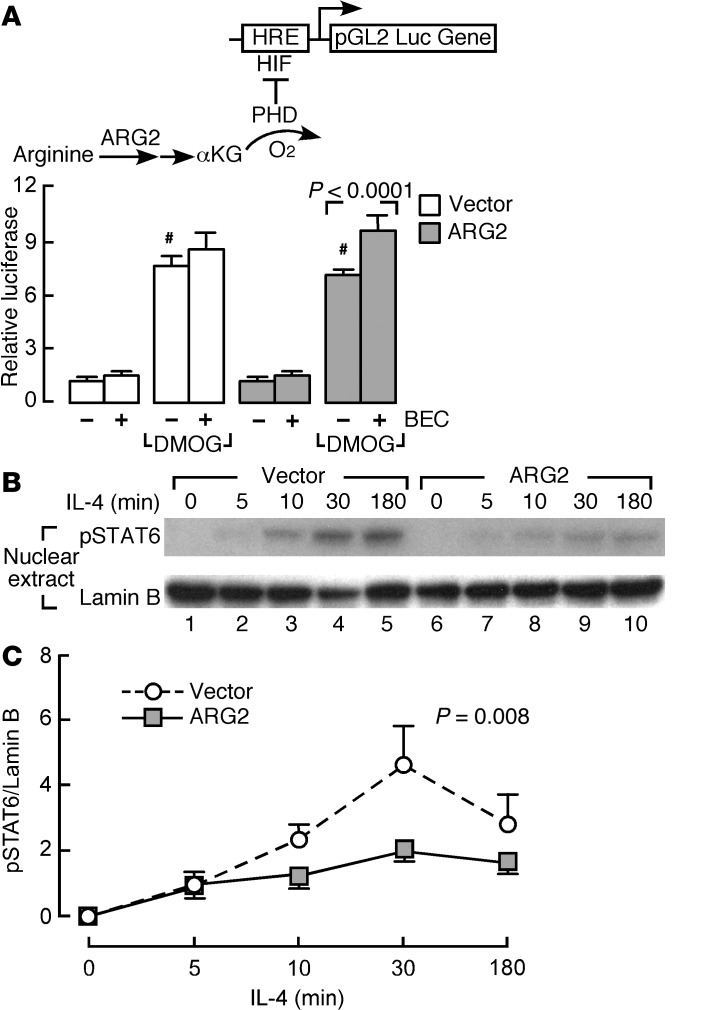
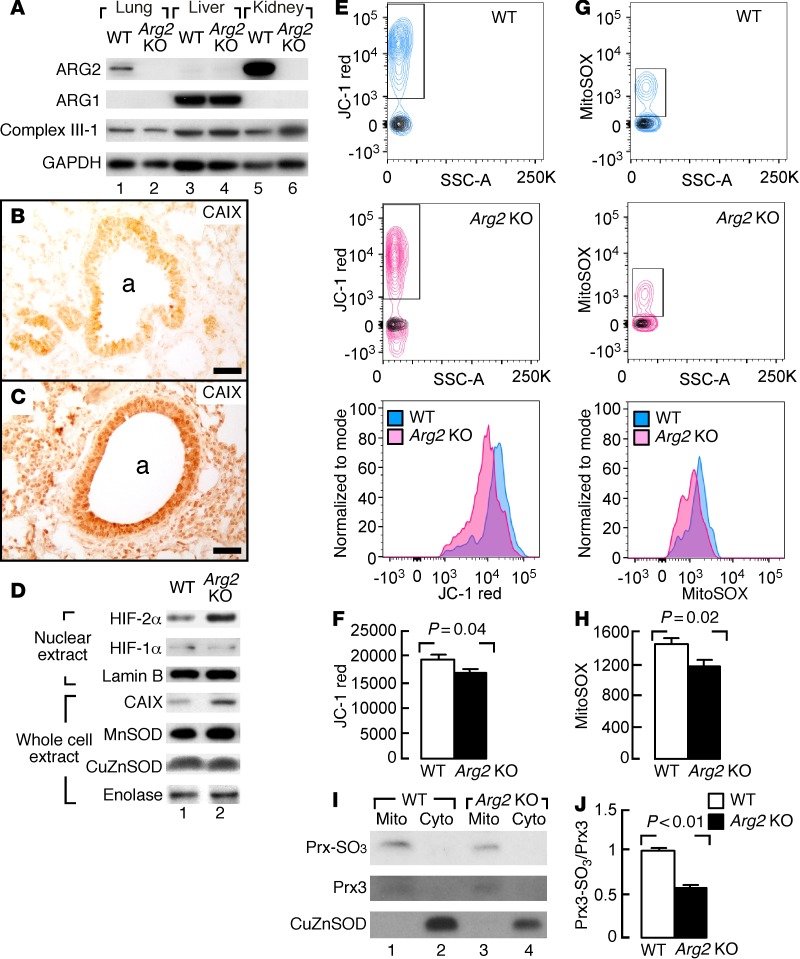
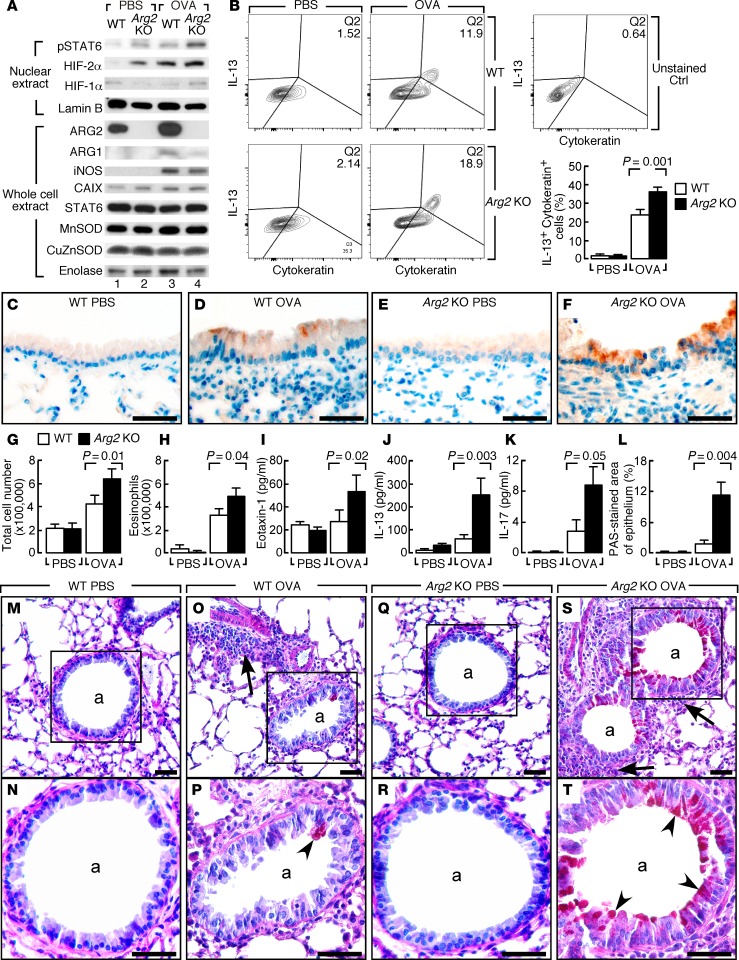
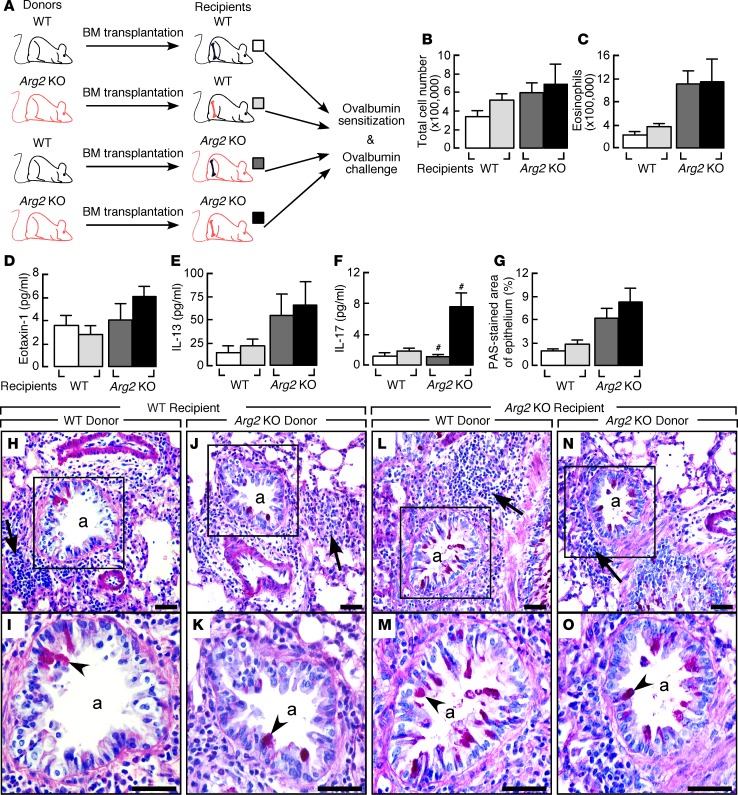
High levels of arginine metabolizing enzymes, including inducible nitric oxide synthase (iNOS) and arginase (ARG), are typical in asthmatic airway epithelium; however, little is known about the metabolic effects of enhanced arginine flux in asthma. Here, we demonstrated that increased metabolism sustains arginine availability in asthmatic airway epithelium with consequences for bioenergetics and inflammation. Expression of iNOS, ARG2, arginine synthetic enzymes, and mitochondrial respiratory complexes III and IV was elevated in asthmatic lung samples compared with healthy controls. ARG2 overexpression in a human bronchial epithelial cell line accelerated oxidative bioenergetic pathways and suppressed hypoxia-inducible factors (HIFs) and phosphorylation of the signal transducer for atopic Th2 inflammation STAT6 (pSTAT6), both of which are implicated in asthma etiology. Arg2-deficient mice had lower mitochondrial membrane potential and greater HIF-2α than WT animals. In an allergen-induced asthma model, mice lacking Arg2 had greater Th2 inflammation than WT mice, as indicated by higher levels of pSTAT6, IL-13, IL-17, eotaxin, and eosinophils and more mucus metaplasia. Bone marrow transplants from Arg2-deficient mice did not affect airway inflammation in recipient mice, supporting resident lung cells as the drivers of elevated Th2 inflammation. These data demonstrate that arginine flux preserves cellular respiration and suppresses pathological signaling events that promote inflammation in asthma.


Figures

Figure 1
Figure 1. Arginine metabolism and bioenergetics in asthma.
(A) The citrulline-NO and tricarboxylic acid (TCA) cycles. iNOS converts arginine to citrulline and NO. ARG2 converts arginine to ornithine and urea. Ornithine aminotransferase (OAT) converts ornithine to glutamate, which gives rise to αKG to enter the TCA cycle producing reducing equivalents for electron transport chain (ETC) to generate membrane potential for ATP. Aspartate transaminase (AST) uses glutamate to transaminate TCA cycle intermediate oxaloacetate and produces aspartate. Argininosuccinate synthetase (ASS) uses citrulline and aspartate as substrates to form argininosuccinate, which is cleaved by argininosuccinate lyase (ASL) to form arginine and fumarate, linking arginase and iNOS pathways via the citrulline-NO and TCA cycles. (B) Expression in bronchial epithelial cell lysates by Western blot. Cytokeratin confirms epithelial cells obtained by airway brushing. Replicate samples run on parallel gels are presented. (C) Relative units (means ± SEM) in human bronchial epithelial cells (control n ≥ 4, asthma n ≥ 10); 2-tailed t test except 1-tailed t test for complex III-1 and complex IV-4. (DG) IHC of ARG2 and ASS in endobronchial biopsies of controls and asthmatics. ARG2 is more prominent in asthmatic bronchial epithelium (F) than control (D). Images representative of multiple sections from 15 asthmatics and 7 controls. Bronchial epithelial cells of asthma (G) show stronger cytoplasmic positivity for ASS than control (E). Images representative of multiple sections from 5 asthmatics and 5 controls. Scale bars: 40 μm. (HK) Immunogold electron microscopy analyses of ARG2 and ASS in epithelium from endobronchial biopsies. I, higher magnification of H, and K of J. White arrowhead shows gold particles. Images representative of 5 individuals. M, mitochondrion. Scale bars: 250 nm.
Figure 2
Figure 2. Ultrastructure of mitochondria in asthma airway epithelium.
Ultrastructural analyses of bronchial epithelium from control (AC) and asthma (DF). C, close-up view of A; B and F, close-up of D and E. Cilia are visible on cells (A and D). Mitochondria are concentrated in apical regions. High power reveals hyperdense mitochondria with tightly coiled inner membrane (F, white arrowhead) and lesser electron-dense mitochondria (F, black arrowhead) in asthma and control (C, arrow). Images representative of 4 asthmatics and 6 controls. N, nuclear. All scale bars: 1 μm.
Figure 3
Figure 3. Protein expression and functional activity of bronchial epithelial cells with ARG2 overexpression.
(A) Arginase activity in bronchial epithelial cells (BET1A) transfected with ARG2 is greater than control vector (n ≥ 2 replicate experiments). Arginase inhibitor S-(2-boronoethyl)-l-cysteine (BEC) returns urea levels to baseline, confirming ARG activity. Two-tailed t test. (B) Mitochondrial (Mito) and cytosolic (Cyto) fractions for ARG2, voltage-dependent anion channel (VDAC), and enolase in BET1A cells transfected with control vector or ARG2 (n = 3). (C) Protein expression in BET1A cells transfected with control or ARG2 vector in the presence and absence of BEC for the doses indicated (n ≥ 3 replicate experiments). Enolase as a loading control. Replicate samples run on parallel gels are presented. (D) Quantification of relative expressions in BET1A cells transfected with control or ARG2 vector in the presence and absence of BEC (n ≥ 3 replicate experiments, ANOVA). #P < 0.05, 2-tailed t test, ARG2-expressing vs. control-transfected cells. *P < 0.05, 2-tailed t test, ARG2-expressing cells without BEC vs. with BEC. (EL) Ultrastructure of mitochondria in BET1A cells transfected with ARG2 vector (G and H), control vector (E and F), mitochondrial GFP (MtGFP) (I and J), or mitochondrial localized manganese superoxide dismutase (MnSOD) (K and L) (n ≥ 3 replicate experiments). Mitochondria in BET1A cells overexpressing ARG2 have greater electron density than cells with empty vector or overexpressing other mitochondrial-localized proteins. F, H, J, and L are close-up views of boxed areas in E, G, I, and K, respectively. N, nuclear. All scale bars: 1 μm. White arrows indicate mitochondrion.
Figure 4
Figure 4. Bioenergetics of bronchial epithelial cells with ARG2 overexpression.
(A) The oxygen consumption rate (OCR) of cells (n = 3 replicate experiments). Inhibitors assess mitochondrial function. The ATPase inhibitor oligomycin, the mitochondrial uncoupler FCCP, and rotenone (ETC complex I inhibitor) and antimycin A (ETC complex III inhibitor) were injected sequentially after measurement of basal rates. OCR relative to vector: the OCR of ARG2-transfected cells normalized to basal OCR of BET1A cells transfected with control vector. (B) Extracellular acidification rate (ECAR) of cells (n = 3 replicate experiments). Glucose, oligomycin, and the glycolysis inhibitor 2-deoxyglucose (2-DG) were injected sequentially. ECAR relative to vector: ECAR of ARG2-transfected cells normalized to basal OCR of BET1A cells transfected with control vector. mpH, pmoles H+/min. (C) Radioisotope studies of glucose metabolism in BET1A cells transfected with ARG2 or control vector (n = 3 replicate experiments). (D) Radioisotope studies of glycine cleavage in BET1A cells transfected with ARG2 vector (n = 3 replicate experiments). All 2-tailed t tests except B, Van der Waerden test, and lactate production in C, median test.
Figure 5
Figure 5. HIF luciferase reporter activity and STAT6 activation in bronchial epithelial cells with ARG2 overexpression.
(A) HRE-driven luciferase activity in BET1A cells transiently transfected with ARG2 vector or control vector and cotransfected with WT HRE-luciferase reporter and Renilla construct, treated with the prolyl hydroxylase (PHD) inhibitor dimethyloxalylglycine (DMOG) (which competes with αKG for PHD) and/or the ARG inhibitor BEC. Data are fold induction over untreated control vector (n ≥ 8 replicate experiments). #P = 0.03, DMOG-exposed ARG2-expressing cells vs. DMOG-exposed control vector–transfected cells, 2-tailed t test. (B and C) IL-4–induced STAT6 activation in BET1A cells transfected with ARG2 or control vector. After transfection, cells were cultured in the presence and absence of IL-4 (10 ng/ml) for the times indicated. (B) Cell nuclear extracts were collected and blotted for phospho-STAT6 (pSTAT6), with lamin B as loading control. (C) IL-4–induced phosphorylation of STAT6 as fold induction over cells transfected with control vector at time point 5 minutes (n ≥ 3, ANOVA).
Figure 6
Figure 6. ARG2 expression and metabolic rates in Arg2–/– (KO) mice.
(A) Western blot analyses of lungs, livers, and kidneys of mice with Arg2 KO or WT (n ≥ 4 replicate experiments). GAPDH as a loading control. (B and C) Increased expression of carbonic anhydrase IX (CAIX) in lungs of mice with Arg2 KO (C) compared with WT (B). Images representative of 2 Arg2 KO and 2 WT lungs. a, airways. Scale bars: 40 μm. (D) Western blot analyses of HIF-2α and downstream gene CAIX expression in lungs of mice with Arg2 KO (n = 6) compared with WT (n = 7). Lamin B as a loading control for nuclear protein. Enolase as a loading control for whole cell extract. (EH) Mitochondrial membrane potential and mitochondrial superoxide in mouse airway epithelial cells. Cells stained with JC-1 (E) and MitoSOX (G), respectively. Contour plots show gating of JC-1 red+ or MitoSOX+ cells. Overlaying black contour graphs show fluorescence levels of unstained controls. Histogram overlays of JC-1 red+ (F) or MitoSOX+ cells (H) show a decrease in Arg2 KO mice (n = 10) compared with WT mice (n = 10). Bar graph quantification of mean fluorescence intensities in JC-1+ or MitoSOX + subsets. Two-tailed t test. (I and J) Mitochondrial (Mito) and cytosolic (Cyto) fractions analyzed via Western blot for peroxiredoxin-SO3 (PRX-SO3) and total PRX3 expression in lungs of mice with Arg2 KO (n = 7) compared with WT (n = 7). Two-tailed t test.
Figure 7
Figure 7. Arg2 genetic deletion in inflammation and goblet cell metaplasia in OVA model.
(A) Representative protein expressions in lungs of Arg2 KO challenged with aerosolized OVA or PBS. Lamin B as loading control for nuclear protein. Enolase as a loading control for whole cell extract. n ≥ 3 replicate experiments. (B) Flow cytometry of IL-13 in cytokeratin-positive cells from lungs of OVA/OVA–treated Arg2 KO and WT. IL-13 expression in cytokeratin-positive cells (cytokeratin+, epithelial marker) increases in WT and Arg2 KO in the OVA/OVA model, but IL-13 is higher in Arg2 KO compared with WT. n ≥ 3 replicate experiments. (CF) IHC of IL-13. Positive staining in airway epithelium of Arg2 KO OVA/OVA and WT OVA/OVA. Arg2 KO OVA/OVA has greater IL-13 expression than WT OVA/OVA. n ≥ 3 replicate experiments. Scale bars: 40 μm. (GK) Elevated total cells (G), eosinophils (H), eotaxin-1 (I), IL-13 (J), and IL-17 (K) in BAL of OVA/OVA–treated Arg2 KO. n ≥ 3 replicate experiments. K, 2-tailed t test; G, H, J, Wilcoxon, and I, median test. (L) Mucin-positive cells by PAS in airways of Arg2 KO compared with WT in OVA/OVA. n ≥ 4 replicate experiments. Two-tailed t test. (MT) Airway goblet cell metaplasia (PAS staining) in Arg2 KO OVA/OVA mice. N, close-up of M, P of O, R of Q, and T of S. Goblet cells not observed in medium-sized or small airways in OVA/PBS–treated WT (M and N) or Arg2 KO (Q and R). Goblet cell metaplasia (red cells, black arrowheads) is more prominent in Arg2 KO OVA/OVA (S and T) than WT OVA/OVA (O and P). n ≥ 4 replicate experiments. Black arrows show inflammatory infiltrate; arrowheads, positive PAS staining. a, airways. Scale bars: 40 μm.
Figure 8
Figure 8. Effects of bone marrow ablation and reconstitution between Arg2 KO and WT in the OVA/OVA asthma model.
(A) Arg2 KO and WT underwent bone marrow ablation and reconstitution, then OVA sensitization and challenge. (BF) Total cells (B), eosinophils (C), eotaxin-1 (D), IL-13 (E), and IL-17 (F) in BAL of Arg2 KO and WT receiving bone marrow transplant from Arg2 KO or WT in the OVA/OVA asthma model. n ≥ 4 replicate experiments. #P = 0.01, Arg2 KO recipients receiving bone marrow from Arg2 KO vs. WT, 2-tailed t test. (G) Quantification of PAS staining in airways of Arg2 KO and WT mice receiving bone marrow from Arg2 KO or WT in the OVA/OVA model. n ≥ 4 replicate experiments. Two-tailed t test. (HO) Airway goblet cell metaplasia (PAS staining) in airways of Arg2 KO and WT receiving bone marrow from Arg2 KO or WT in the OVA/OVA model. I, close-up view of H, K of J, M of L, and O of N. n ≥ 4 replicate experiments. Black arrows show inflammatory infiltrate; arrowheads, PAS+ staining. a, airways. Scale bars: 40 μm.

References

    1. Comhair SA, Erzurum SC. Redox control of asthma: molecular mechanisms and therapeutic opportunities. Antioxid Redox Signal. 2010;12(1):93–124. doi: 10.1089/ars.2008.2425. - DOI - PMC - PubMed
    1. Ghosh S, et al. Nitrotyrosine proteome survey in asthma identifies oxidative mechanism of catalase inactivation. J Immunol. 2006;176(9):5587–5597. doi: 10.4049/jimmunol.176.9.5587. - DOI - PubMed
    1. Larsen FJ, et al. Dietary inorganic nitrate improves mitochondrial efficiency in humans. Cell Metab. 2011;13(2):149–159. doi: 10.1016/j.cmet.2011.01.004. - DOI - PubMed
    1. Dweik RA, et al. Nitric oxide synthesis in the lung. Regulation by oxygen through a kinetic mechanism. J Clin Invest. 1998;101(3):660–666. doi: 10.1172/JCI1378. - DOI - PMC - PubMed
    1. Mathrani VC, Kenyon NJ, Zeki A, Last JA. Mouse models of asthma: can they give us mechanistic insights into the role of nitric oxide? Curr Med Chem. 2007;14(20):2204–2213. doi: 10.2174/092986707781389628. - DOI - PubMed