. 2016 Jul 1;126(7):2509-18.
doi: 10.1172/JCI83942. Epub 2016 May 23.

Paracellular epithelial sodium transport maximizes energy efficiency in the kidney

Paracellular epithelial sodium transport maximizes energy efficiency in the kidney

Lei Pei et al. J Clin Invest. .

Abstract

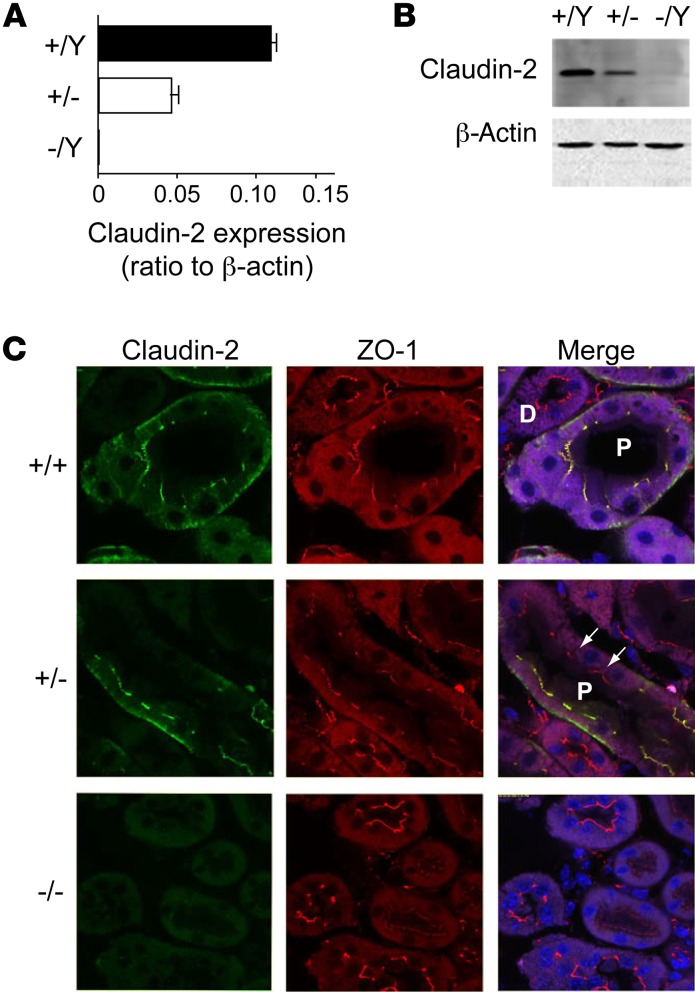
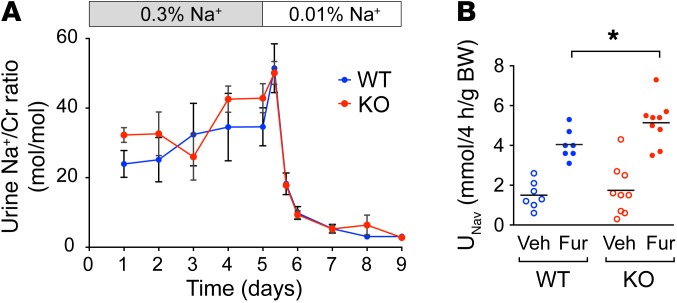
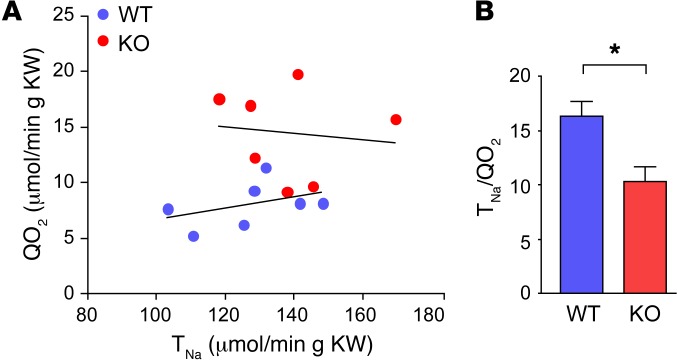
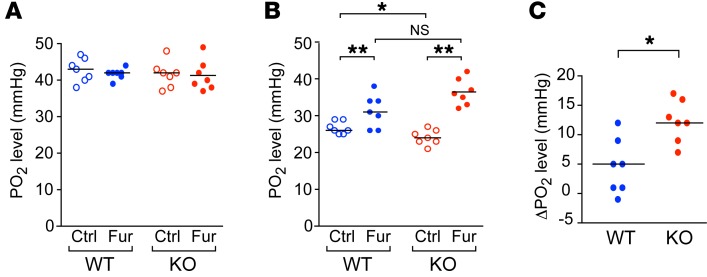
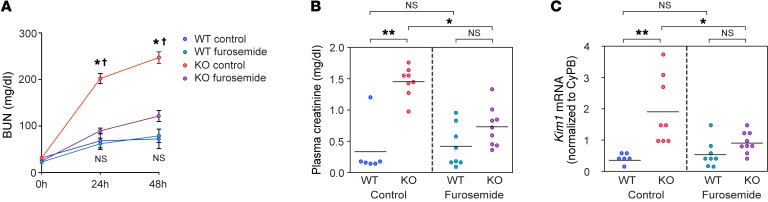
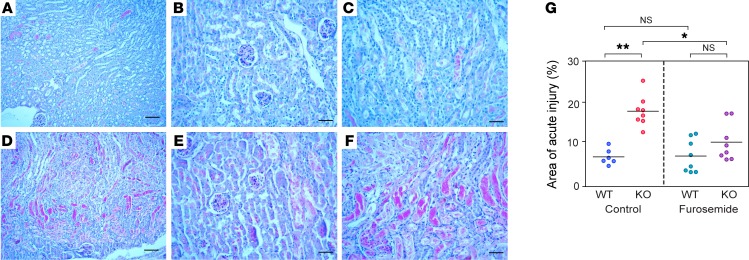
Efficient oxygen utilization in the kidney may be supported by paracellular epithelial transport, a form of passive diffusion that is driven by preexisting transepithelial electrochemical gradients. Claudins are tight-junction transmembrane proteins that act as paracellular ion channels in epithelial cells. In the proximal tubule (PT) of the kidney, claudin-2 mediates paracellular sodium reabsorption. Here, we used murine models to investigate the role of claudin-2 in maintaining energy efficiency in the kidney. We found that claudin-2-null mice conserve sodium to the same extent as WT mice, even during profound dietary sodium depletion, as a result of the upregulation of transcellular Na-K-2Cl transport activity in the thick ascending limb of Henle. We hypothesized that shifting sodium transport to transcellular pathways would lead to increased whole-kidney oxygen consumption. Indeed, compared with control animals, oxygen consumption in the kidneys of claudin-2-null mice was markedly increased, resulting in medullary hypoxia. Furthermore, tubular injury in kidneys subjected to bilateral renal ischemia-reperfusion injury was more severe in the absence of claudin-2. Our results indicate that paracellular transport in the PT is required for efficient utilization of oxygen in the service of sodium transport. We speculate that paracellular permeability may have evolved as a general strategy in epithelial tissues to maximize energy efficiency.


Figures

Figure 1
Figure 1. Characterization of claudin-2–KO mice.
(A) Quantification of whole-kidney mRNA levels of claudin-2 relative to β-actin in claudin-2 hemizygous KO (–/Y), heterozygous (+/–), and WT (+/Y) mice (n = 6 per group). (B) Western blot of whole-kidney lysates probed with mouse anti–claudin-2 antibody showing a band at the expected size for claudin-2. Lower panel shows an immunoblot for β-actin as a loading control. (C) Immunolocalization of claudin-2. Frozen sections of mouse kidney were double stained with claudin-2 antibody (green) and antibody against ZO-1 (red), a tight-junction marker. Note the localization of claudin-2 in WT kidney to the tight junctions of the PTs (P) but not to the distal tubules (D), as well as the faint basolateral staining. In heterozygous mice, PT staining was heterogeneous, with claudin-2 absent from some cells (arrows) but present in others as a result of lyonization.
Figure 2
Figure 2. Effect of claudin-2 KO on renal Na+ handling.
(A) Effect of dietary Na+ depletion. Urine Na excretion rate, expressed as the ratio of Na to creatinine (Cr) concentration (mean ± SEM, n = 4–5 per group), is shown in mice on a normal (0.3%) Na diet (day 1 to day 5), followed by a Na+-deficient (0.01%) diet (day 6 to day 9). (B) Furosemide (Fur) challenge test. Mice were administered vehicle (Veh) i.p. on the first day and furosemide 25 mg/kg on the second day. Urine Na+ excretion after furosemide was greater in KO mice than in WT mice. *P < 0.05, by paired Student’s t test (n = 7–9 per group).
Figure 3
Figure 3. Role of claudin-2 in renal O2 utilization.
(A) Relationship between TNa and QO2 in individual claudin-2 WT and KO mice, expressed per gram of KW. (B) Efficiency of O2 utilization for renal Na+ transport, TNa/QO2, calculated from the data in A (n = 7 per group). *P < 0.01, by Student’s t test.
Figure 4
Figure 4. Effect of claudin-2 KO on intrarenal PO2, as measured with O2-sensing microelectrodes.
(A and B) PO2 in kidney cortex (A) and outer medulla (B) at baseline (Ctrl) and after treatment with furosemide. *P = 0.01 and **P < 0.001, by 2-way ANOVA with simple-effects testing. (C) Change in PO2 (ΔPO2) in the outer medulla induced by furosemide (n = 7 per group). *P < 0.005, by Student’s t test.
Figure 5
Figure 5. Effect of claudin-2 KO on susceptibility to acute renal ischemia.
(A) BUN levels at 0, 24, and 48 hours following bilateral renal IRI in claudin-2–KO mice and their WT littermates, with furosemide or without (control) pretreatment. *P < 0.005 for KO control versus WT control; P < 0.01 for KO control versus KO furosemide; NS, P value was not significant for WT control versus WT furosemide (n = 6–9 per group); 3-way ANOVA with simple-effects testing. (B and C) Plasma creatinine and kidney Kim1 mRNA levels normalized to cyclophilin B (CyPB) 48 hours after IRI. *P < 0.05 and **P < 0.005, by 2-way ANOVA with simple-effects testing.
Figure 6
Figure 6. Histological analysis of acute kidney injury.
Representative images of PAS-stained WT (AC) and KO (DF) kidneys 48 hours after IRI. Panels A and D show low-power views (scale bars: 100 μm); panels B and E show high-power views of the cortex; and panels C and F show high-power views of the outer medulla. Scale bars: 50 μm. (G) Histological scoring of acute injury, expressed as the percentage of kidney area involved. *P < 0.01 and **P < 0.001, by Student’s t test (n = 6–8 per group).

Comment in

References

    1. Farquhar MG, Palade GE. Junctional complexes in various epithelia. J Cell Biol. 1963;17:375–412. doi: 10.1083/jcb.17.2.375. - DOI - PMC - PubMed
    1. Staehelin LA. Further observations on the fine structure of freeze-cleaved tight junctions. J Cell Sci. 1973;13(3):763–786. - PubMed
    1. Whittembury G, Rawlins FA. Evidence of a paracellular pathway for ion flow in the kidney proximal tubule. Electromicroscopic demonstration of lanthanum precipitate in the tight junction. Pflugers Arch. 1971;330(4):302–309. doi: 10.1007/BF00588582. - DOI - PubMed
    1. Machen TE, Erlij D, Wooding FB. Permeable junctional complexes. The movement of lanthanum across rabbit gallbladder and intestine. J Cell Biol. 1972;54(2):302–312. doi: 10.1083/jcb.54.2.302. - DOI - PMC - PubMed
    1. Martínez-Palomo A, Erlij D. The distribution of lanthanum in tight junctions of the kidney tubule. Pflugers Arch. 1973;343(3):267–272. doi: 10.1007/BF00586049. - DOI - PubMed

Publication types

MeSH terms