. 2016 May 23;17(1):106.
doi: 10.1186/s13059-016-0975-3.

SLICER: inferring branched, nonlinear cellular trajectories from single cell RNA-seq data

Affiliations

SLICER: inferring branched, nonlinear cellular trajectories from single cell RNA-seq data

Joshua D Welch et al. Genome Biol. .

Abstract

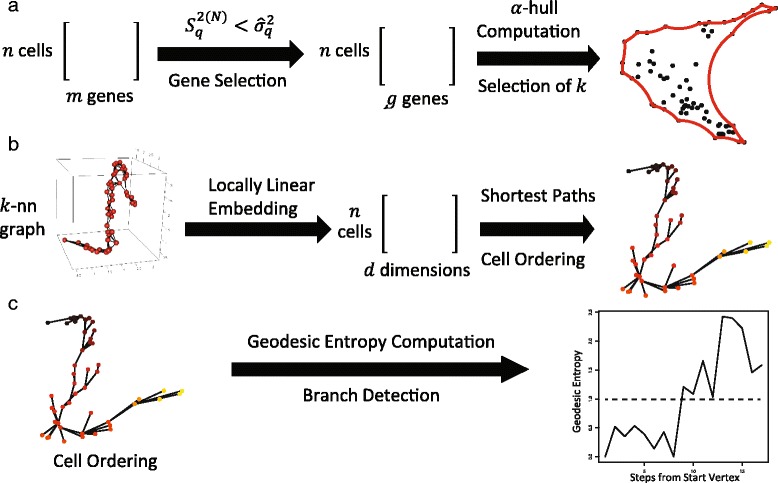
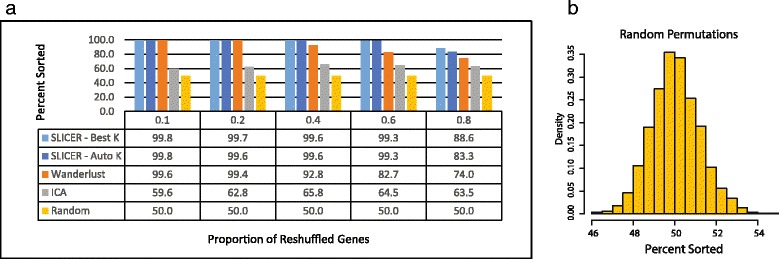
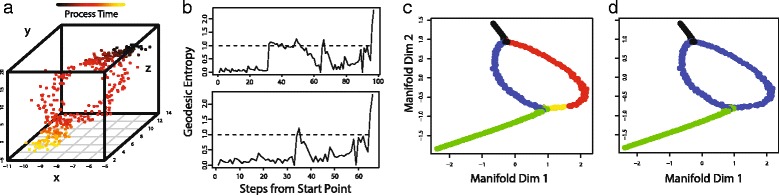
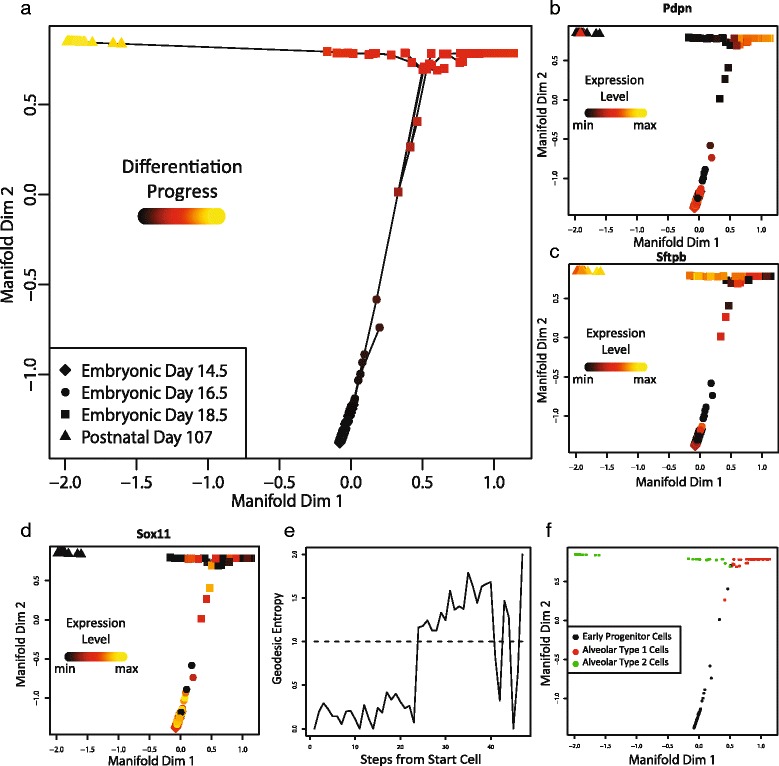
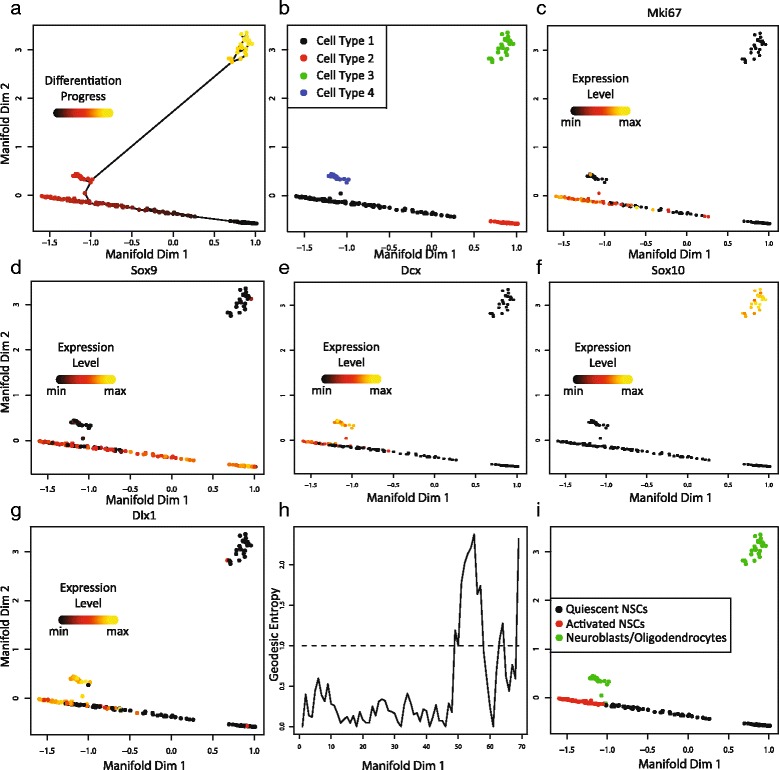
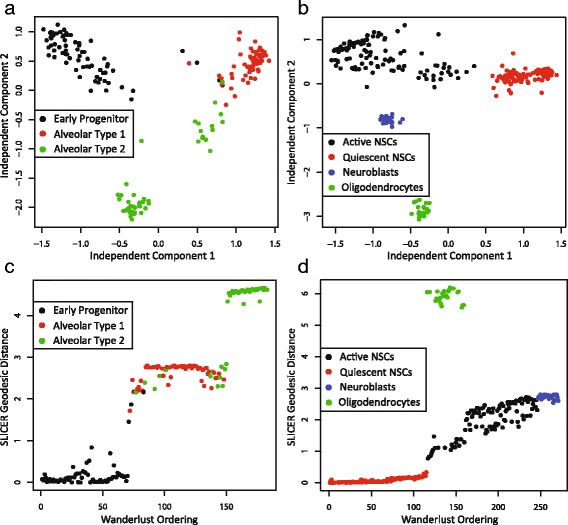
Single cell experiments provide an unprecedented opportunity to reconstruct a sequence of changes in a biological process from individual "snapshots" of cells. However, nonlinear gene expression changes, genes unrelated to the process, and the possibility of branching trajectories make this a challenging problem. We develop SLICER (Selective Locally Linear Inference of Cellular Expression Relationships) to address these challenges. SLICER can infer highly nonlinear trajectories, select genes without prior knowledge of the process, and automatically determine the location and number of branches and loops. SLICER recovers the ordering of points along simulated trajectories more accurately than existing methods. We demonstrate the effectiveness of SLICER on previously published data from mouse lung cells and neural stem cells.

Keywords: Manifold learning; Single cell RNA-seq; Time series.


Figures

Fig. 1
Fig. 1
Overview of SLICER method. a Genes to use in building a trajectory are selected by comparing sample variance and neighborhood variance. Note that this gene selection method does not require either prior knowledge of genes involved in the process or differential expression analysis of cells from multiple time points. Next, the number of nearest neighbors k to use in constructing a low-dimensional embedding is chosen so as to yield the shape that most resembles a trajectory, as measured by the a-convex hull of the cells. b SLICER builds a k-nearest neighbor graph in high-dimensional space and then performs LLE to give a nonlinear low-dimensional embedding of the cells. The low-dimensional embedding is then used to build another neighbor graph, and cells are ordered based on their shortest path distances from a user-specified starting cell. c SLICER computes geodesic entropy based on the collection of shortest paths from the starting cell and uses the geodesic entropy values to detect branches in the cellular trajectory
Fig. 2
Fig. 2
Evaluation of SLICER on synthetic data. a Comparison of performance of SLICER, Wanderlust, ICA, and random shuffling. The synthetic datasets were generated as described in the text using 500 genes, σ = 2 (σ is the noise level), and increasing values of p. A higher p corresponds to an increased probability that a gene will be randomly reshuffled, removing its relationship with the simulated trajectory. To assess the effectiveness of automatic determination of k, SLICER was run both with and without automatic selection of k. Performance was evaluated by counting the number of inversions in the resulting sorted list of cells. b Histogram of percent sortedness values from 1000 random permutations of the simulated trajectory used in panel a. Note that the distribution of values is sharply peaked around 50 % sortedness
Fig. 3
Fig. 3
Synthetic data example showing that SLICER can detect branches and bubbles. a Three simulated genes showing the bubble structure. b Geodesic entropy computed for the trajectory (top) and recursively for the longest branch (bottom). The dotted line in each plot represents an entropy of 1, which indicates the beginning of a branch. c LLE embedding with branches colored. Black is the initial path that splits into two branches (red and blue). The shorter arm of the initial branch then branches again (yellow and green) at the end of the bubble. d Plot showing the boundaries of the bubble (blue) as detected by SLICER
Fig. 4
Fig. 4
SLICER applied to cells from the developing mouse lung. a Cellular trajectory inferred by SLICER. The shape of each point indicates the time point (note that this information is used only after the fact for assessing whether the trajectory makes sense, not for constructing it). Color corresponds to inferred geodesic distance from the start cell (“differentiation progress”). The lines indicate edges used in the shortest paths to each point. Panels b through d show the expression levels of marker genes in each cell, with the cells ordered by developmental time. Panel b shows a marker for alveolar type 1 cells, c is an alveolar type 2 marker, and d is a marker for early progenitor cells. e Geodesic entropy plot for the trajectory shown in panel a. The dotted line represents an entropy value of 1, the threshold for branch detection. f Cells colored according to the branches that SLICER assigned using geodesic entropy. Note that no annotations were used in assigning cells to branches; instead, the interpretations indicated in the legend (AT1, AT2, or EP) were deduced based on marker genes such as those shown in panels bd after branch assignment
Fig. 5
Fig. 5
SLICER applied to mouse neural stem cells. a Cellular trajectory inferred by SLICER. Color corresponds to inferred geodesic distance from the start cell (“differentiation progress”). The lines indicate edges used in the shortest paths to each point. b Clustering using the connected components in the low-dimensional k-nearest neighbor graph before trajectory construction identifies four cell types. SLICER provides the option to select which cell types to include when building a trajectory. Panels c through g show the expression levels of marker genes for different cell types: c active neural stem cells, d quiescent neural stem cells, e neuroblasts, f oligodendrocytes, and g neuroblasts. h Geodesic entropy plot for the trajectory shown in panel a. The dotted line represents an entropy value of 1, the threshold for branch detection. i Cells colored according to the branches that SLICER assigned using geodesic entropy. The interpretations indicated in the legend were deduced based on marker genes such as those shown in panels cg after branch assignment
Fig. 6
Fig. 6
ICA and Wanderlust results from mouse lung and neural cells. Note that the genes selected by SLICER were used as input to both ICA and Wanderlust to ensure an accurate side-by-side comparison. a ICA embedding of mouse lung cells. The colors correspond to the branch assignments from SLICER. b ICA embedding of mouse lung cells. Colors correspond to the SLICER cell type assignments from Fig. 5b. c Comparison of one-dimensional Wanderlust ordering (x-axis) and SLICER geodesic distance (y-axis) for mouse lung cells. d Comparison of one-dimensional Wanderlust ordering (x-axis) and SLICER geodesic distance (y-axis) for mouse neural cells

References

    1. Trapnell C, Cacchiarelli D, Grimsby J, Pokharel P, Li S, Morse M, Lennon NJ, Livak KJ, Mikkelsen TS, Rinn JL. The dynamics and regulators of cell fate decisions are revealed by pseudotemporal ordering of single cells. Nat Biotechnol. 2014;32:381–6. - PMC - PubMed
    1. Bendall SC, Davis KL, Amir E-AD, Tadmor MD, Simonds EF, Chen TJ, Shenfeld DK, Nolan GP, Pe’er D. Single-cell trajectory detection uncovers progression and regulatory coordination in human B cell development. Cell. 2014;157:714–25. - PMC - PubMed
    1. Moignard V, Woodhouse S, Haghverdi L, Lilly AJ, Tanaka Y, Wilkinson AC, Buettner F, Macaulay IC, Jawaid W, Diamanti E, Nishikawa S-I, Piterman N, Kouskoff V, Theis FJ, Fisher J, Göttgens B. Decoding the regulatory network of early blood development from single-cell gene expression measurements. Nat Biotechnol. 2015;33:269–76. - PMC - PubMed
    1. Llorens-Bobadilla E, Zhao S, Baser A, Saiz-Castro G, Zwadlo K, Martin-Villalba A. Single-cell transcriptomics reveals a population of dormant neural stem cells that become activated upon brain injury. Cell Stem Cell. 2015;17:329–40. doi: 10.1016/j.stem.2015.07.002. - DOI - PubMed
    1. Hanchate NK, Kondoh K, Lu Z, Kuang D, Ye X, Qiu X, Pachter L, Trapnell C, Buck LB. Single-cell transcriptomics reveals receptor transformations during olfactory neurogenesis. Science (80-). 2015;350:1251–5. - PMC - PubMed

Publication types