. 2017 Mar;101(3):353-359.
doi: 10.1136/bjophthalmol-2016-308668. Epub 2016 May 23.

Five-year visual acuity outcomes and injection patterns in patients with pro-re-nata treatments for AMD, DME, RVO and myopic CNV

Affiliations

Five-year visual acuity outcomes and injection patterns in patients with pro-re-nata treatments for AMD, DME, RVO and myopic CNV

Thomas Wecker et al. Br J Ophthalmol. 2017 Mar.

Abstract

Background: Anti vascular endothelial growth factor (VEGF) therapy is an established treatment for various retinal diseases. Long-term data on injection frequencies and visual acuity (VA), however, are still rare.

Methods: Five-year analysis of real-life VA developments and injection patterns from 2072 patients (2577 eyes; 33 187 injections) with chronically active disease undergoing pro-re-nata treatment for age-related macular degeneration (AMD), diabetic macular oedema (DME), retinal vein occlusion (RVO) and myopic choroidal neovascularisation (CNV).

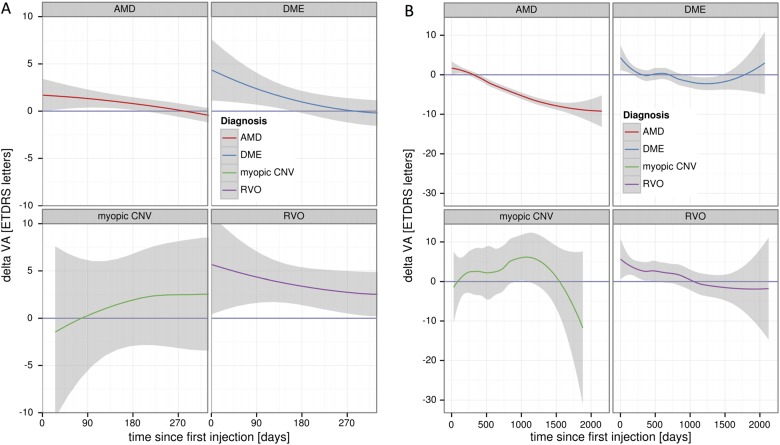
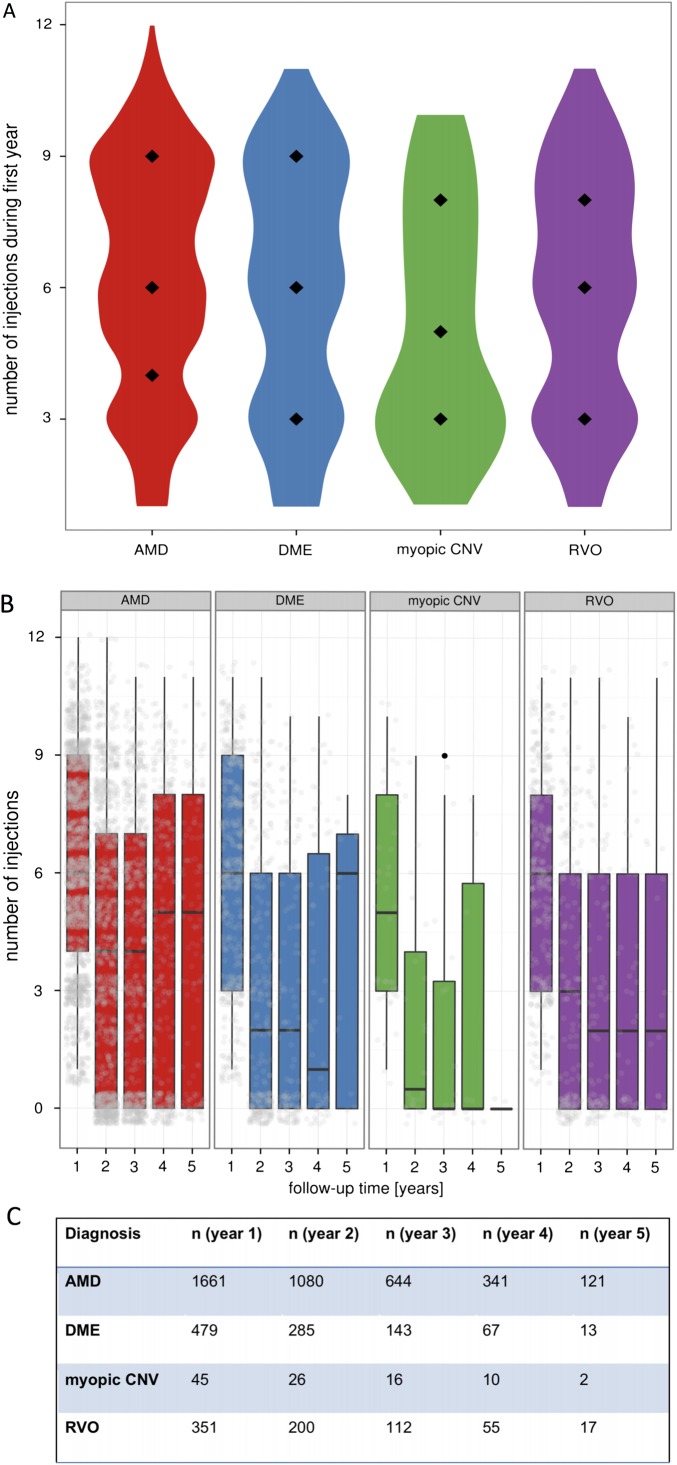
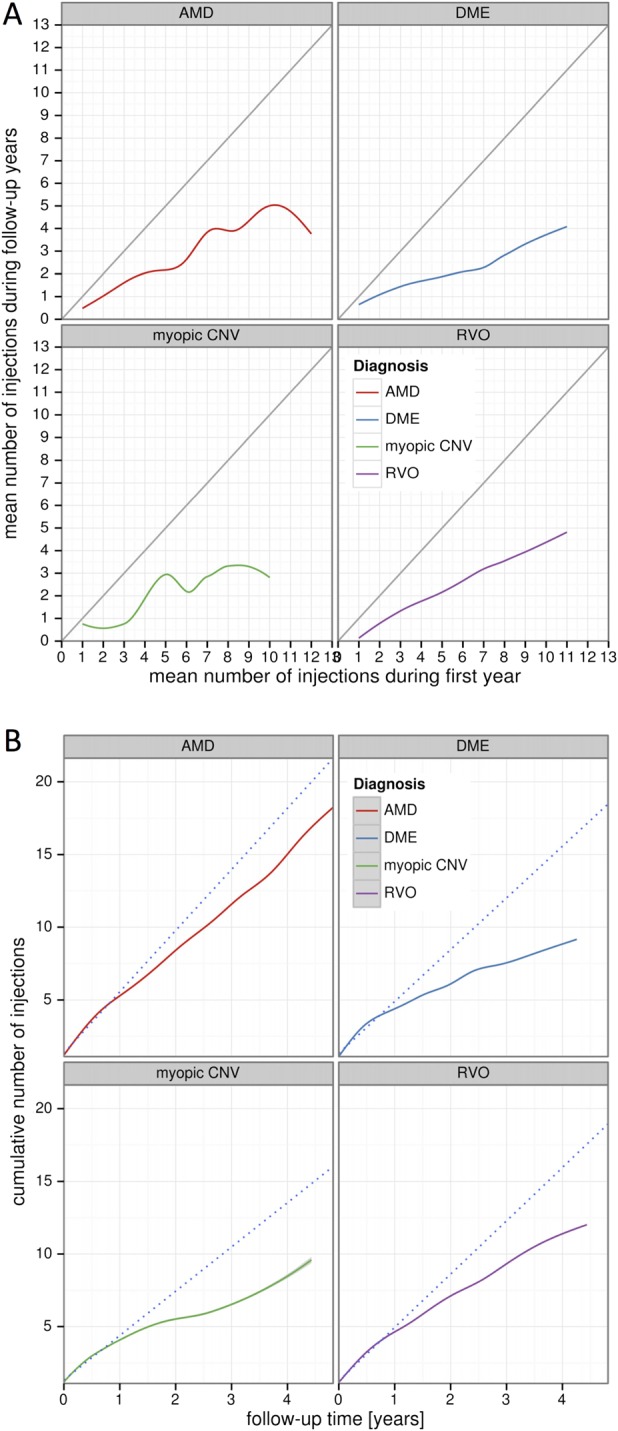
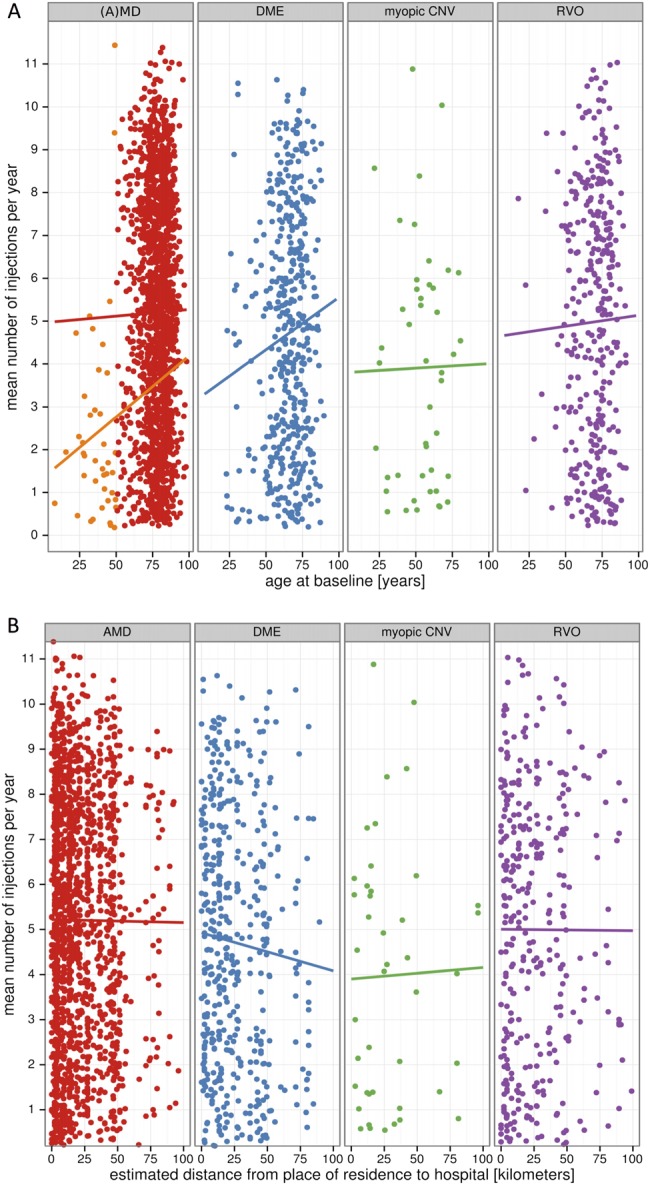
Results: Maximum mean VA gain in year 1 was+5.2 letters in AMD, +6.2 in DME, +10 in RVO and+7.2 in myopic CNV. Over 5 years, however, VA in patients with AMD declined. By year 5, 34% of patients with AMD had experienced VA loss of >15 letters, 56% had remained stable and 10% had gained >15 letters. Long-term VA developments in DME and RVO were more favourable with 81% of DME and 79% of patients with RVO gaining or maintaining vision at 5 years. In AMD, median injection frequency was six in year 1 and between four and five in consecutive years. In DME and RVO, median injection frequency was six in year 1 but lower compared with AMD in consecutive years. Injection frequency in DME was weakly associated with patient age (rs=0.1; p=0.03).

Conclusions: In AMD, the initial VA gain was not maintained long term despite higher injection numbers compared with DME, RVO and myopic CNV. The presented real-world data provide a peer-group-based estimate of VA developments and injection frequencies for counselling patients undergoing long-term anti-VEGF therapy.

Keywords: Angiogenesis; Macula; Neovascularisation; Retina.


Conflict of interest statement

Competing interests: None declared.

Figures

Figure 1
Figure 1
Relative numbers of patients with visual acuity (VA) gain, stabilisation or loss over 5 years. Graphic representation (A) and tabulated view (B) of VA changes categorised by groups. Green colour in (A) indicates VA gain of ≥15 ETDRS letters, yellow colour stable VA within±15 letters and red colour VA loss of ≥15 letters. In age-related macular degeneration (AMD), the percentage of patients with significant VA loss increases over time to 34% at year 5. In diabetic macular oedema (DME) and retinal vein occlusion (RVO), this increase is less pronounced. In DME, there is even a slight increase in the percentage of patients with significant VA gain in year 5 compared with year 1. For myopic choroidal neovascularisation (CNV), initial VA response is good but numbers are low for later time points. Numbers (n) in this graph represent eyes for which VA data was available from the indicated year.
Figure 2
Figure 2
Absolute visual acuity (VA) change over time. (A) In the first treatment year, mean VA increased initially in all indications. However, patients with age-related macular degeneration (AMD) and diabetic macular oedema (DME) returned close to±0 letters by the end of year 1. Retinal vein occlusion (RVO) eyes, in contrast, maintained some of their VA gain until the end of year 1. For eyes with myopic choroidal neovascularisation (CNV), the 95% CI (grey colour) is very wide due to low overall numbers in this group, limiting reliable data interpretation for these patients. Note that maximum VA gain was an average of +5.2 letters for AMD, +6.2 letters for DME, +7.2 letters for myopic CNV and +10.0 letters for RVO. This maximum VA gain, however, occurred at different time points for each patient. As a result mean, VA change for any given time point in the graph is less pronounced. (B) Over the full 5-year observational time frame, mean VA in AMD eyes declined considerably, while mean VA for DME and RVO eyes remained close to±0 letters from baseline. Note that later time points reflect a selection of patients with persistent disease activity still requiring injections. Patients with earlier treatment termination will have been lost to follow-up at our centre at these later time points.
Figure 3
Figure 3
Injection numbers during year 1 and consecutive years. (A) Median injection numbers in the first year were six in age-related macular degeneration (AMD), diabetic macular oedema (DME) and retinal vein occlusion (RVO) eyes and five in eyes with myopic choroidal neovascularisation (CNV). Black diamonds represent the median and 25 and 75 quartiles, respectively. (B) Injection frequencies declined in all indications for most of the follow-up years but remained highest in AMD compared with all other indications. Black line represents median, and grey dots represent individual eyes (dots are scattered for better visibility). Note that there are significant numbers of patients with zero injections in each follow-up year. These patients did not receive injections in this particular year, but follow-up data exists. (C) Tabulated view of number of eyes (n) available for analysis at each indicated year. Over 600 AMD eyes had complete follow-up data available for at least 3 years (>100 for DME and RVO). Numbers for myopic CNV were low with only 45 patients even at year 1. Only patients with completed follow-up years were analysed.
Figure 4
Figure 4
Association between injections in year 1 and consecutive years as well as cumulative injection numbers. (A) Injections in year 1 (x-axis) are plotted against the mean injection number from follow-up years (y-axis). The grey line represents a hypothetical line for patients receiving the same number of injections in year 1 and follow-up years. In all indications, the true injection curves are below this hypothetical line indicating that injection numbers in follow-up years are lower than in year 1. In all indications, patients with high injection numbers in year 1 tend to receive higher injection numbers in the consecutive years. (B) Cumulative injection numbers over time. The dotted line represents a hypothetical line for patients that would have carried forward their injection frequencies from year 1 into the follow-up years. For all indications, true cumulative injection curves are below this line indicating slower accumulation of injections during follow-up years. For patients with age-related macular degeneration (AMD), however, the slope of the cumulative injection curve remains relatively steep yielding the highest number of cumulative injections over time in AMD compared with the other indications.
Figure 5
Figure 5
Associations of injection frequencies with (A) patient age and (B) distance between patient's place of residence and our hospital. (A) Eyes with diabetic macular oedema (DME) displayed a positive but weak correlation between patient age and mean number of injections (rs=0.1; p=0.03). For all other indications, there was no such association. However, patients with AMD (red) received on average more injections compared to a group of younger macular disease (MD) patients with CNV from other causes (orange). (B) Across all indications, there was no association of injection frequencies with distance between patient's place of residence and our hospital.

References

    1. Rosenfeld PJ, Moshfeghi AA, Puliafito CA. Optical coherence tomography findings after an intravitreal injection of bevacizumab (avastin) for neovascular age-related macular degeneration. Ophthalmic Surg Lasers Imaging 2005;36:331–5. - PubMed
    1. Brown DM, Kaiser PK, Michels M, et al. . Ranibizumab versus verteporfin for neovascular age-related macular degeneration. N Engl J Med 2006;355:1432–44. 10.1056/NEJMoa062655 - DOI - PubMed
    1. Rosenfeld PJ, Brown DM, Heier JS, et al. . Ranibizumab for neovascular age-related macular degeneration. N Engl J Med 2006;355:1419–31. 10.1056/NEJMoa054481 - DOI - PubMed
    1. Heier JS, Brown DM, Chong V, et al. . Intravitreal aflibercept (VEGF trap-eye) in wet age-related macular degeneration. Ophthalmology 2012;119:2537–48. 10.1016/j.ophtha.2012.09.006 - DOI - PubMed
    1. Rofagha S, Bhisitkul RB, Boyer DS, et al. . Seven-year outcomes in ranibizumab-treated patients in ANCHOR, MARINA, and HORIZON: a multicenter cohort study (SEVEN-UP). Ophthalmology 2013;120:2292–9. 10.1016/j.ophtha.2013.03.046 - DOI - PubMed

Publication types

MeSH terms