. 2016 May 24:6:26699.
doi: 10.1038/srep26699.

A genomic screen for long noncoding RNA genes epigenetically silenced by aberrant DNA methylation in colorectal cancer

Affiliations

A genomic screen for long noncoding RNA genes epigenetically silenced by aberrant DNA methylation in colorectal cancer

Kohei Kumegawa et al. Sci Rep. .

Abstract

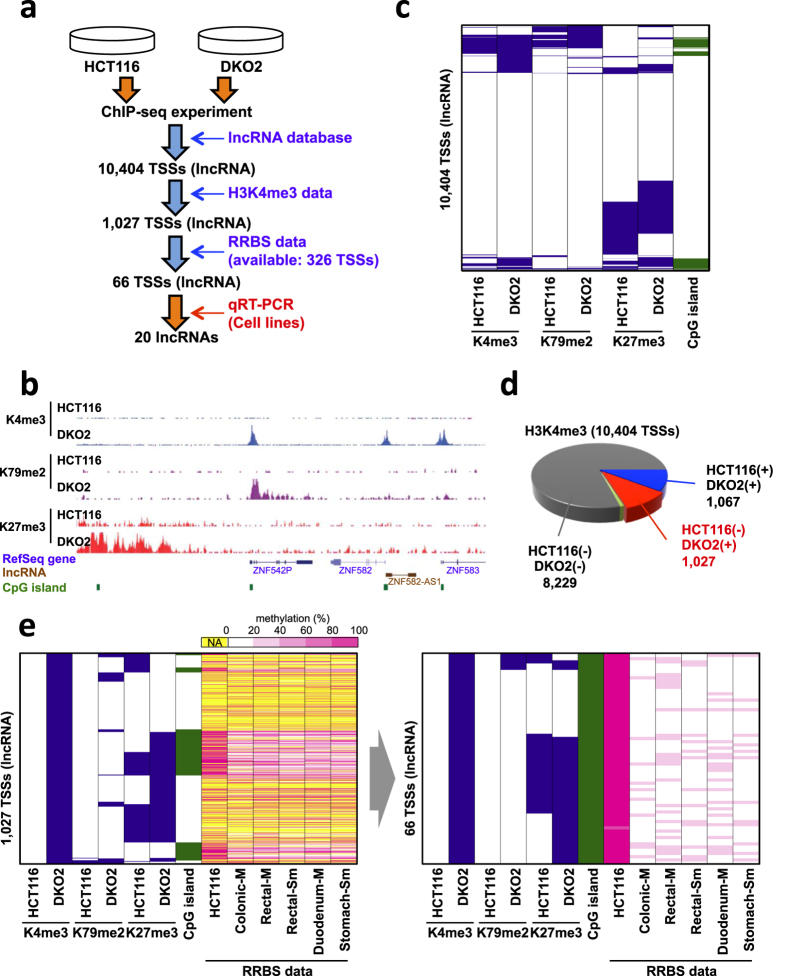
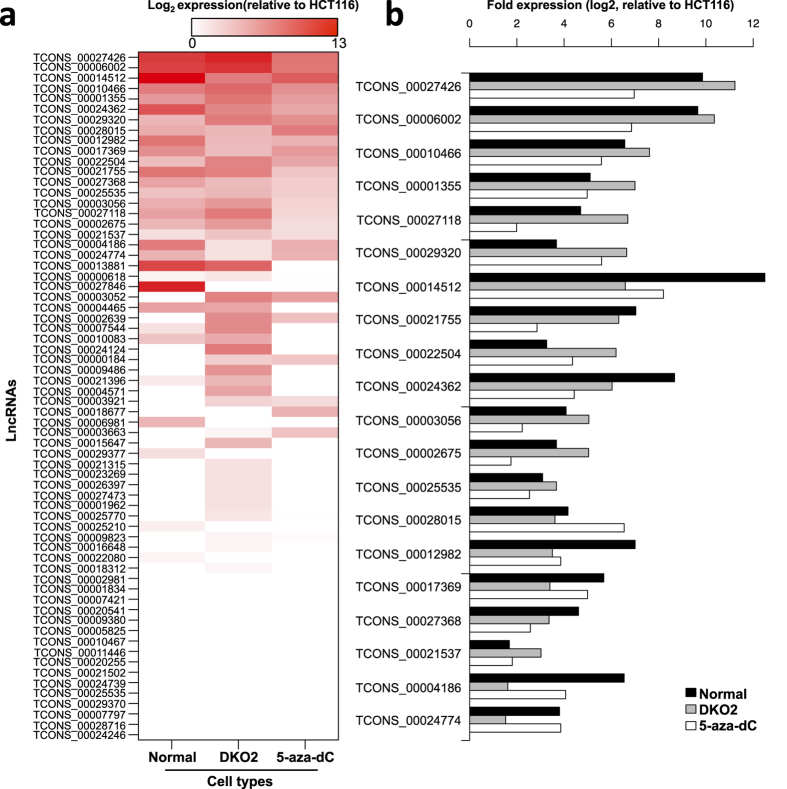
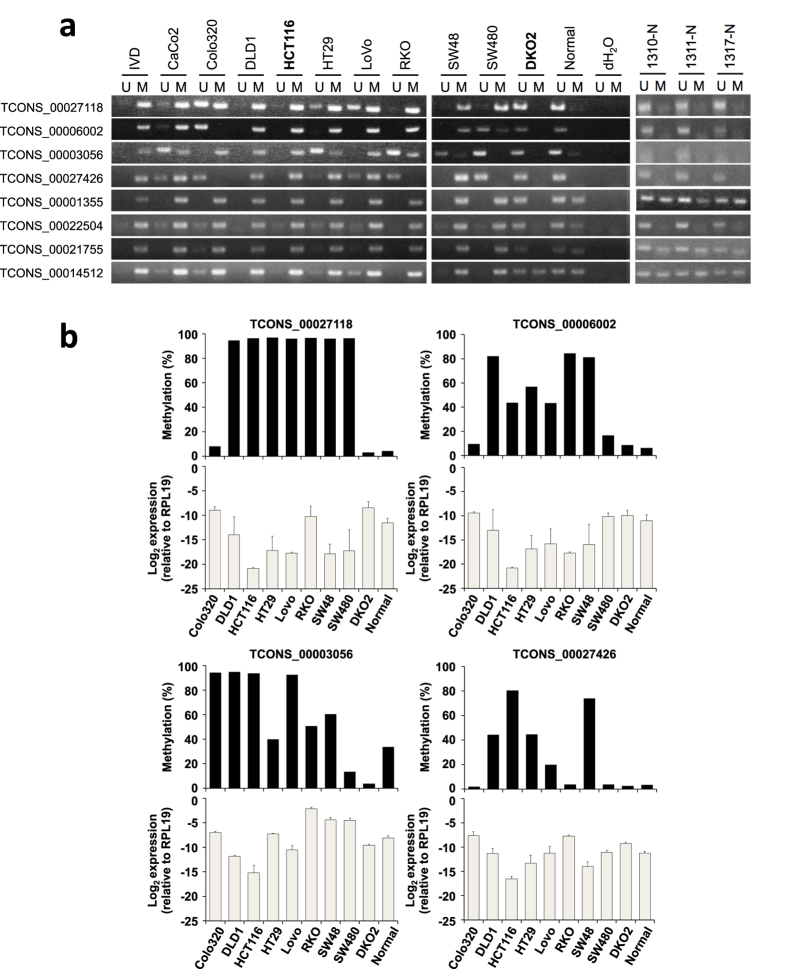
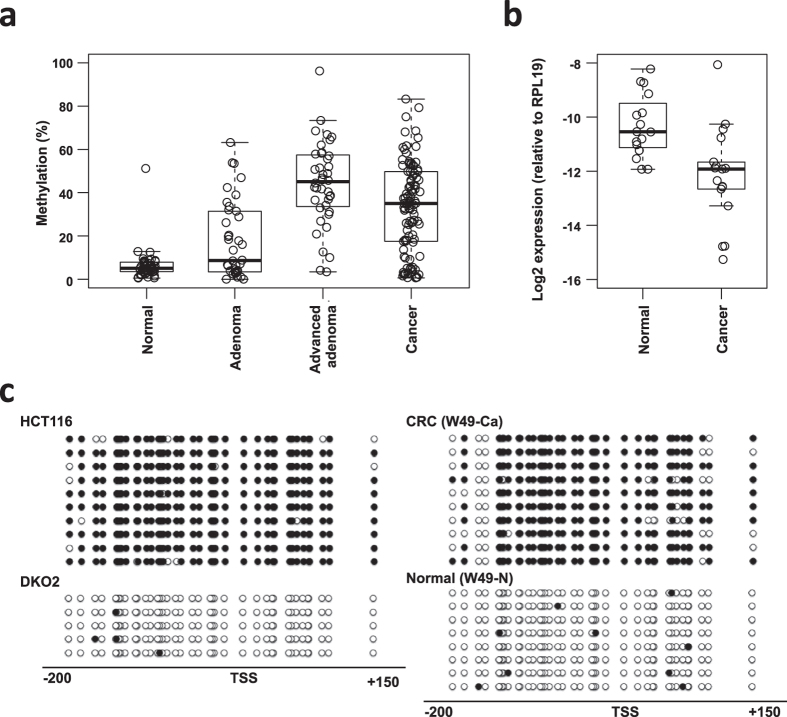
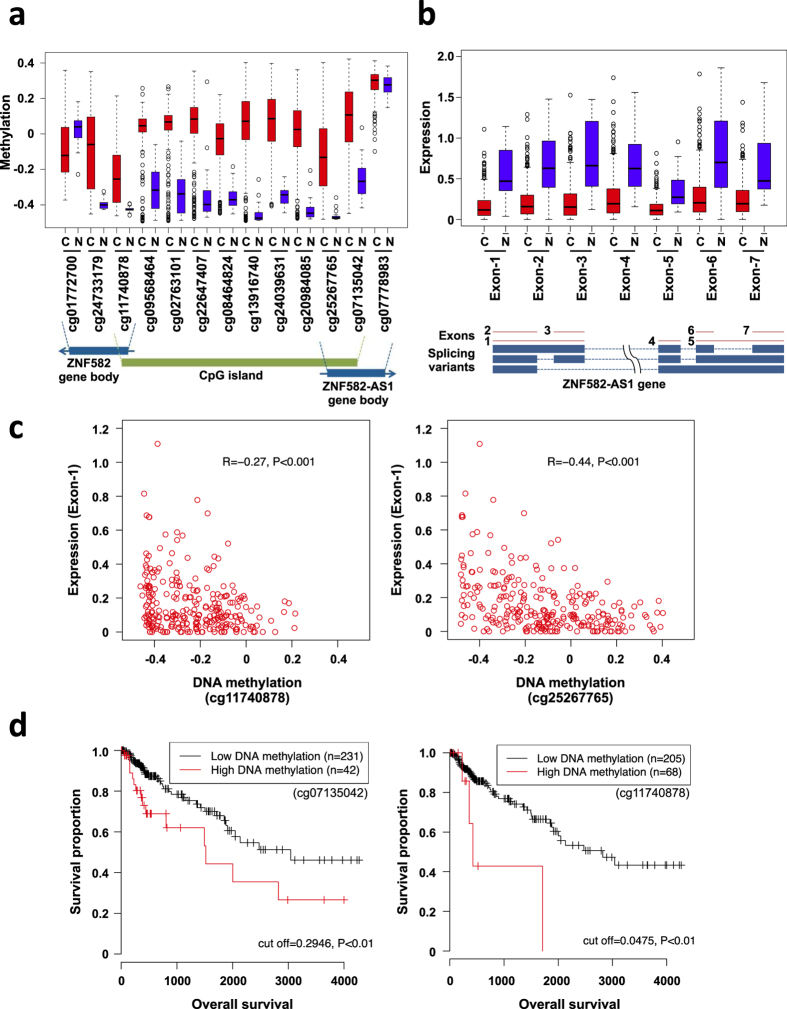
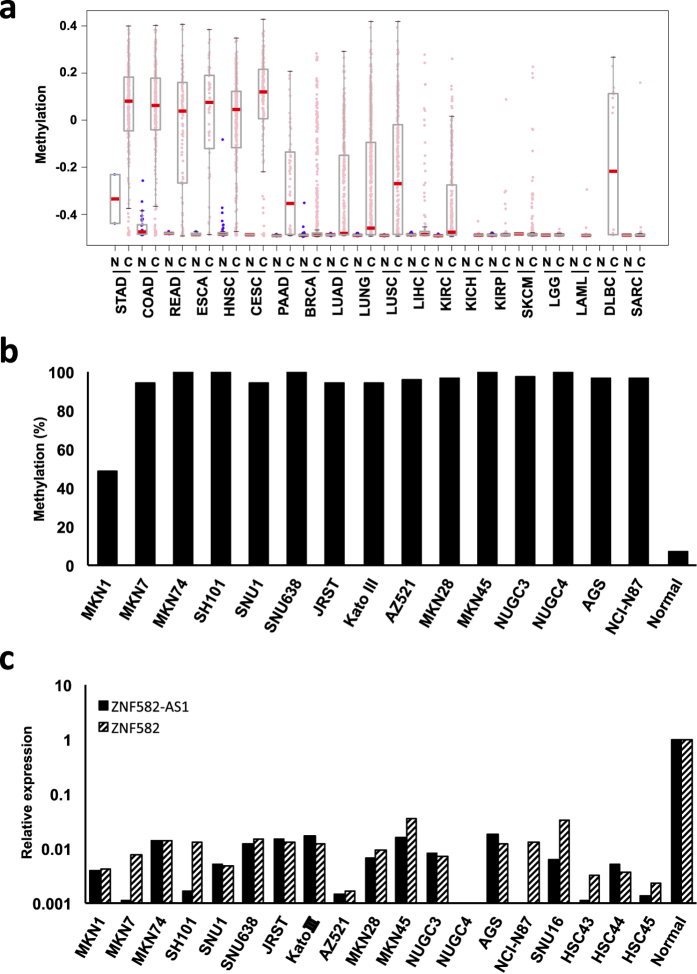
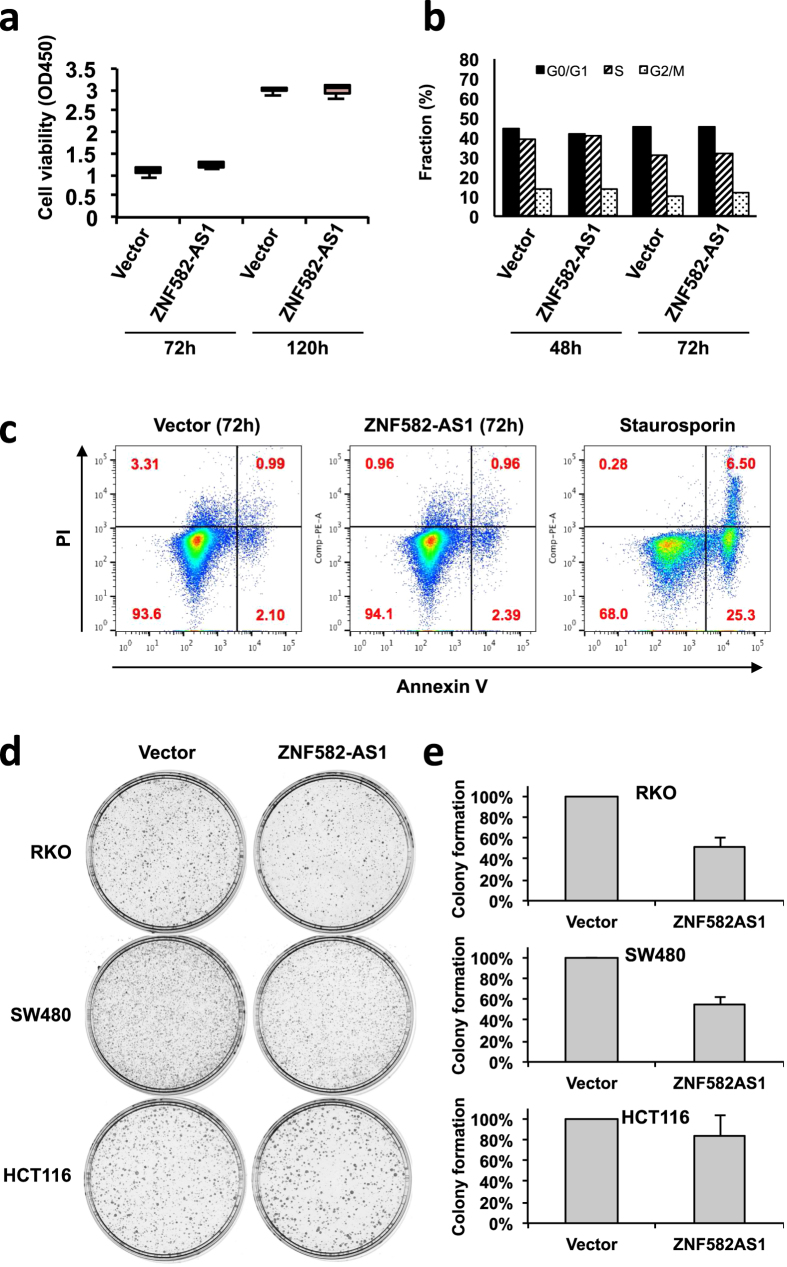
Long noncoding RNAs (lncRNAs) have emerged as key components in multiple cellular processes, although their physiological and pathological functions are not fully understood. To identify cancer-related lncRNAs, we screened for those that are epigenetically silenced in colorectal cancer (CRC). Through a genome-wide analysis of histone modifications in CRC cells, we found that the transcription start sites (TSSs) of 1,027 lncRNA genes acquired trimethylation of histone H3 lysine 4 (H3K4me3) after DNA demethylation. Integrative analysis of chromatin signatures and the DNA methylome revealed that the promoter CpG islands (CGIs) of 66 lncRNA genes contained cancer-specific methylation. By validating the expression and methylation of lncRNA genes in CRC cells, we ultimately identified 20 lncRNAs, including ZNF582-AS1, as targets of epigenetic silencing in CRC. ZNF582-AS1 is frequently methylated in CRC cell lines (87.5%), primary CRCs (77.2%), colorectal adenomas (44.7%) and advanced adenomas (87.8%), suggesting that this methylation is an early event during colorectal tumorigenesis. Methylation of ZNF582-AS1 is associated with poor survival of CRC patients, and ectopic expression of ZNF582-AS1 suppressed colony formation by CRC cells. Our findings offer insight into the association between epigenetic alterations and lncRNA dysregulation in cancer and suggest that ZNF582-AS1 may be a novel tumor-suppressive lncRNA.


Conflict of interest statement

The authors declare no competing financial interests.

Figures

Figure 1
Figure 1. Screen for epigenetically silenced lncRNA genes in CRC.
(a) Workflow of the screen to identify lncRNAs silenced in association with aberrant CGI methylation in CRC. (b) Representative results of a ChIP-seq analysis in HCT116 and DKO2 cells. (c) Heat map showing the presence (blue) or absence (white) of histone modifications (H4K4me3, H3K79me2 and H3K27me3) at the TSS regions of lncRNA genes in HCT116 and DKO2 cells. The presence (green) or absence (white) of a CGI is also indicated on the right. (d) The fraction of TSSs with an H3K4me3 mark in HCT116 and DKO2 cells. Shown are the numbers of TSSs with the indicated H3K4me3 status in the two cell lines. (e) Heat maps showing the histone modifications at selected TSSs in CRC cells. Shown is the DNA methylation status obtained from RRBS data sets for HCT116 and normal gastrointestinal tissues. A set of 1,027 TSSs with increased H3K4me3 in DKO2 cells is shown on the left, and 66 TSSs with cancer-specific CGI methylation are shown on the right. Colonic-M, colonic mucosa; Rectal-M, rectal mucosa; Rectal-Sm, rectal smooth muscle; Duodenum-M, duodenum mucosa; Stomach-Sm, stomach smooth muscle; NA, not available.
Figure 2
Figure 2. Analysis of lncRNA expression.
(a) Heat map showing the expression of 66 lncRNAs in normal colon, HCT116 cells treated with 5-aza-dC and DKO2 cells. Expression levels of the indicated lncRNAs were determined by quantitative RT-PCR, after which, the results were normalized to the expression levels in untreated HCT116 cells. The color scale indicates the relative expression levels on a log2 scale. (b) Expression of 20 lncRNAs in normal colon, HCT116 cells treated with 5-aza-dC and DKO2 cells. The results were normalized to the expression levels in untreated HCT116 cells.
Figure 3
Figure 3. DNA methylation and expression of lncRNA genes in CRC cells.
(a) Methylation-specific PCR analysis of the promoter CGIs of the indicated lncRNA genes in CRC cell lines, a normal colonic tissue from a healthy individual (24 yo), and normal colonic tissues from CRC patients (1310-N, 74 yo; 1311-N, 75 yo; 1317-N, 79 yo). Bands in the “M” lanes are PCR products obtained with methylation-specific primers. Those in the “U” lanes are products obtained with unmethylation-specific primers. In vitro-methylated DNA (IVD) serves as a positive control. (b) The relationship between DNA methylation and expression of lncRNA genes in CRC cells and a normal colonic tissue. Shown are the results of bisulfite pyrosequencing (black bars) and quantitative RT-PCR (white bar) analysis of the four selected lncRNA genes. RT-PCR results were normalized to the internal RPL19 expression.
Figure 4
Figure 4. DNA methylation and expression of TCONS_00027118 (ZNF582-AS1) in clinical samples.
(a) Summary of bisulfite pyrosequencing of the CGI of ZNF582-AS1 in normal colon (n = 46), colorectal adenomas (n = 38), advanced adenomas (n = 40) and primary CRCs (n = 101). Each dot represents a single specimen, and the first, second and third quartiles are shown as box plots. (b) Quantitative RT-PCR results for ZNF582-AS1 in normal colonic tissues (n = 16) and primary CRCs (n = 17). (c) Bisulfite sequencing results for the ZNF582-AS1 CGI in HCT116, DKO2 and a pair of primary CRC (W49-Ca) and normal colon tissues (W49-N, age 84 yo). Open and filled circles represent unmethylated and methylated CpG sites, respectively.
Figure 5
Figure 5. DNA methylation and ZNF582-AS1 expression analyzed in primary CRCs using TCGA data sets.
(a) Levels of DNA methylation in the promoter CGI and gene bodies of ZNF582 and ZNF582-AS1 in normal colon (N; n = 38) and primary CRCs (C; n = 285). β-values for the Infinium HumanMethylation450 BeadChip at respective CpG sites are shown as box plots. Probe IDs for the Infinium platform are indicated below. (b) Expression levels of the indicated ZNF582-AS1 exons in normal colon (n = 50) and primary CRCs (n = 364) determined by RNA-seq. Shown below are the gene structures of the transcriptional ZNF582-AS1 variants and regions analyzed by RNA-seq. (c) Correlations between DNA methylation at the indicated probe sets and expression of ZNF582-AS1 exon 1. The Pearson correlation coefficients and P values are shown. (d) Kaplan-Meier curves showing the effect of DNA methylation at the indicated probe sets on overall survival among CRC patients. The β-value cut-off for the respective probe sets, and the P values are also shown.
Figure 6
Figure 6. DNA methylation and ZNF582-AS1 expression in cancers of various origins.
(a) Levels of DNA methylation in the promoter CGI of ZNF582-AS1 in the indicated tumors (C) and corresponding normal tissues (N) analyzed using TCGA data sets. STAD: stomach adenocarcinoma, COAD: colon adenocarcinoma, READ: rectum adenocarcinoma, ESCA: esophageal carcinoma, HNSC: head and neck squamous cell carcinoma, CESC: cervical and endocervical cancer, PAAD: pancreatic adenocarcinoma, BRCA: breast invasive carcinoma, LUAD: lung adenocarcinoma, LUNG: lung cancer, LUSC: lung squamous cell carcinoma, LIHC: liver hepatocellular carcinoma, KIRC: kidney clear cell carcinoma, KICH: kidney chromophobe, KIRP: kidney papillary cell carcinoma, SKCM: skin cutaneous melanoma, LGG: brain lower grade glioma, LAML: acute myeloid leukemia, DLBC: diffuse large B-cell lymphoma, SARC: sarcoma. (b) Levels of ZNF582-AS1 methylation in gastric cancer cell lines and normal gastric mucosa analyzed using bisulfite pyrosequencing. (c) Quantitative RT-PCR analysis of ZNF582-AS1 and ZNF582 in a series of gastric cancer cell lines and normal stomach tissues. The results are normalized to internal RPL19 expression.
Figure 7
Figure 7. Functional analysis of ZNF582-AS1 in CRC cells.
(a) RKO cells were transfected with expression constructs encoding ZNF582-AS1 or a control vector, after which, cell viability was assessed in WST-8 assays at the indicated time points. (b) Cell cycle distribution of RKO cells transfected with ZNF582-AS1 vector or a control vector was measured by pulse EdU incorporation and DNA content in flow cytometric analysis. Percentages of cells in the G0/G1, S, and G2/M phases are shown. (c) RKO cells transfected with ZNF582-AS1 or a control vector were incubated with Annexin V and PI, and labeled cells were analyzed on flow cytometry. Annexin V-positive cells indicate the apoptotic population, and double-positive cells indicate the necrotic population. Cells treated with Staurosporin serve as a positive control for the experiment. (d) Representative results of a colony-formation assay performed with the indicated CRC cells. (e) Relative colony formation efficiencies of CRC cells transfected with ZNF582-AS1 or a control vector. Shown are means of three replicates; the error bars represent standard deviations.

Similar articles

Cited by

References

    1. Geisler S. & Coller J. RNA in unexpected places: long non-coding RNA functions in diverse cellular contexts. Nature reviews Molecular cell biology 14, 699–712 (2013). - PMC - PubMed
    1. Fatica A. & Bozzoni I. Long non-coding RNAs: new players in cell differentiation and development. Nature reviews Genetics 15, 7–21 (2014). - PubMed
    1. Lee J. T. Epigenetic regulation by long noncoding RNAs. Science 338, 1435–1439 (2012). - PubMed
    1. Guttman M., Russell P., Ingolia N. T., Weissman J. S. & Lander E. S. Ribosome profiling provides evidence that large noncoding RNAs do not encode proteins. Cell 154, 240–251 (2013). - PMC - PubMed
    1. Gupta R. A. et al.. Long non-coding RNA HOTAIR reprograms chromatin state to promote cancer metastasis. Nature 464, 1071–1076 (2010). - PMC - PubMed

Publication types