

RNA-seq analysis of virR and revR mutants of Clostridium perfringens
- PMID: 27216822
- PMCID: PMC4877802
- DOI: 10.1186/s12864-016-2706-2
RNA-seq analysis of virR and revR mutants of Clostridium perfringens
Abstract
Background: Clostridium perfringens causes toxin-mediated diseases, including gas gangrene (clostridial myonecrosis) and food poisoning in humans. The production of the toxins implicated in gas gangrene, α-toxin and perfringolysin O, is regulated by the VirSR two-component regulatory system. In addition, RevR, an orphan response regulator, has been shown to affect virulence in the mouse myonecrosis model. RevR positively regulates the expression of genes that encode hydrolytic enzymes, including hyaluronidases and sialidases.
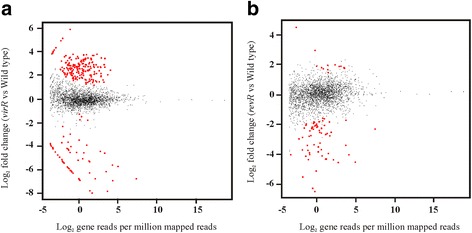
Results: To further characterize the VirSR and RevR regulatory networks, comparative transcriptomic analysis was carried out with strand-specific RNA-seq on C. perfringens strain JIR325 and its isogenic virR and revR regulatory mutants. Using the edgeR analysis package, 206 genes in the virR mutant and 67 genes in the revR mutant were found to be differentially expressed. Comparative analysis revealed that VirR acts as a global negative regulator, whilst RevR acts as a global positive regulator. Therefore, about 95 % of the differentially expressed genes were up-regulated in the virR mutant, whereas 81 % of the differentially expressed genes were down-regulated in the revR mutant. Importantly, we identified 23 genes that were regulated by both VirR and RevR, 18 of these genes, which included the sporulation-specific spoIVA, sigG and sigF genes, were regulated positively and negatively by RevR and VirR, respectively. Furthermore, analysis of the mapped RNA-seq reads visualized as depth of coverage plots showed that there were 93 previously unannotated transcripts in intergenic regions. These transcripts potentially encode small RNA molecules.
Conclusion: In conclusion, using strand-specific RNA-seq analysis, this study has identified differentially expressed chromosomal and pCP13 native plasmid-encoded genes, antisense transcripts, and transcripts within intergenic regions that are controlled by the VirSR or RevR regulatory systems.
Keywords: C. perfringens; Gene transcription; RNA-seq; Reciprocal gene expression.
Figures
Similar articles
-
Regulation of virulence by the RevR response regulator in Clostridium perfringens.Infect Immun. 2011 Jun;79(6):2145-53. doi: 10.1128/IAI.00060-11. Epub 2011 Mar 14. Infect Immun. 2011. PMID: 21402758 Free PMC article.
-
Analysis of the virulence-associated RevSR two-component signal transduction system of Clostridium perfringens.Int J Med Microbiol. 2016 Sep;306(6):429-42. doi: 10.1016/j.ijmm.2016.05.011. Epub 2016 May 20. Int J Med Microbiol. 2016. PMID: 27267179
-
Regulation of toxin gene expression in Clostridium perfringens.Res Microbiol. 2015 May;166(4):280-9. doi: 10.1016/j.resmic.2014.09.010. Epub 2014 Oct 7. Res Microbiol. 2015. PMID: 25303832 Review.
-
The VirR/VirS regulatory cascade affects transcription of plasmid-encoded putative virulence genes in Clostridium perfringens strain 13.FEMS Microbiol Lett. 2003 May 16;222(1):137-41. doi: 10.1016/S0378-1097(03)00255-6. FEMS Microbiol Lett. 2003. PMID: 12757957
-
Gene regulation by the VirS/VirR system in Clostridium perfringens.Anaerobe. 2016 Oct;41:5-9. doi: 10.1016/j.anaerobe.2016.06.003. Epub 2016 Jun 11. Anaerobe. 2016. PMID: 27296833 Review.
Cited by
-
Tools to map target genes of bacterial two-component system response regulators.Environ Microbiol Rep. 2020 Jun;12(3):267-276. doi: 10.1111/1758-2229.12838. Epub 2020 Apr 5. Environ Microbiol Rep. 2020. PMID: 32212247 Free PMC article. Review.
-
In Vivo Role of Two-Component Regulatory Systems in Models of Urinary Tract Infections.Pathogens. 2023 Jan 10;12(1):119. doi: 10.3390/pathogens12010119. Pathogens. 2023. PMID: 36678467 Free PMC article. Review.
-
Concurrent Host-Pathogen Transcriptional Responses in a Clostridium perfringens Murine Myonecrosis Infection.mBio. 2018 Mar 27;9(2):e00473-18. doi: 10.1128/mBio.00473-18. mBio. 2018. PMID: 29588405 Free PMC article.
-
Molecular identification of hyaluronate lyase, not hyaluronidase, as an intrinsic hyaluronan-degrading enzyme in Clostridium perfringens strain ATCC 13124.Sci Rep. 2024 Oct 22;14(1):24266. doi: 10.1038/s41598-024-73955-y. Sci Rep. 2024. PMID: 39438475 Free PMC article.
-
Changes in the expression of genes encoding type IV pili-associated proteins are seen when Clostridium perfringens is grown in liquid or on surfaces.BMC Genomics. 2020 Jan 14;21(1):45. doi: 10.1186/s12864-020-6453-z. BMC Genomics. 2020. PMID: 31937237 Free PMC article.
References
-
- Titball R, Rood J. Bacterial phospholipases. In: Bacterial protein toxins. Aktories K, Just I, editors. Berlin Heidelberg: Springer-Verlag; 2000. p. 529–56.
Publication types
MeSH terms
Substances
LinkOut - more resources
Full Text Sources
Other Literature Sources
Molecular Biology Databases
