. 2017 Mar;22(3):375-383.
doi: 10.1038/mp.2016.80. Epub 2016 May 24.

Conditional ablation of neuroligin-1 in CA1 pyramidal neurons blocks LTP by a cell-autonomous NMDA receptor-independent mechanism

Affiliations

Conditional ablation of neuroligin-1 in CA1 pyramidal neurons blocks LTP by a cell-autonomous NMDA receptor-independent mechanism

M Jiang et al. Mol Psychiatry. 2017 Mar.

Abstract

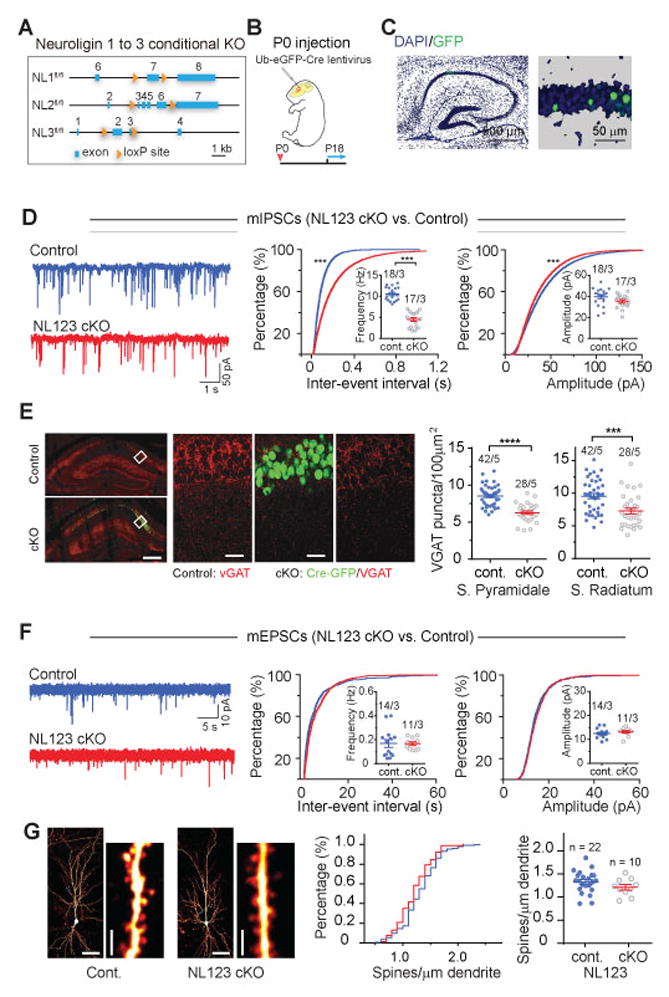
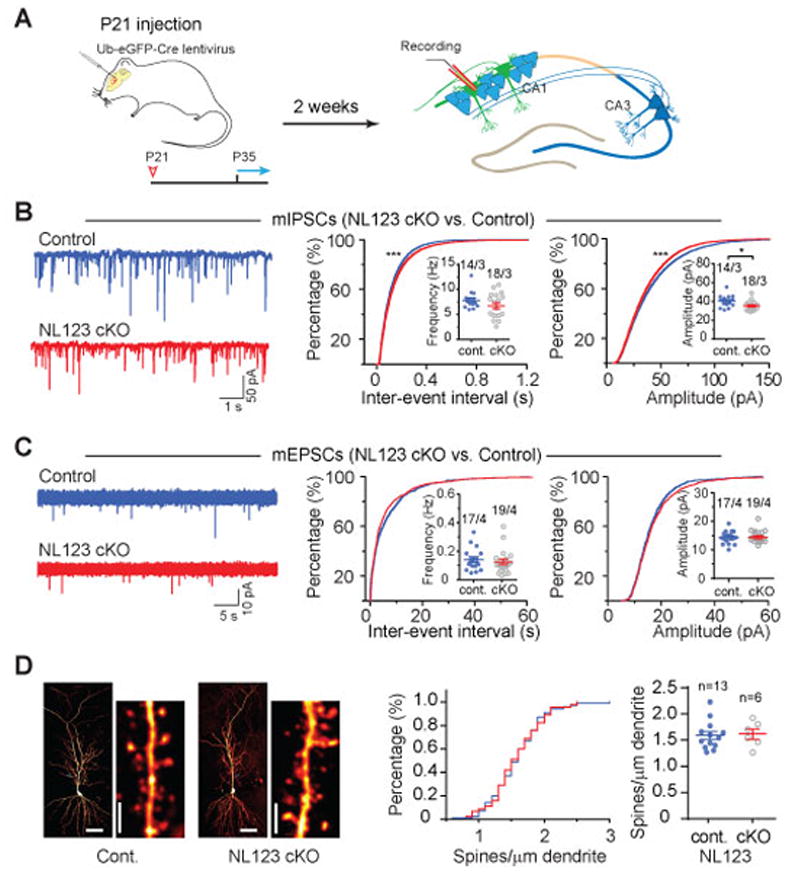
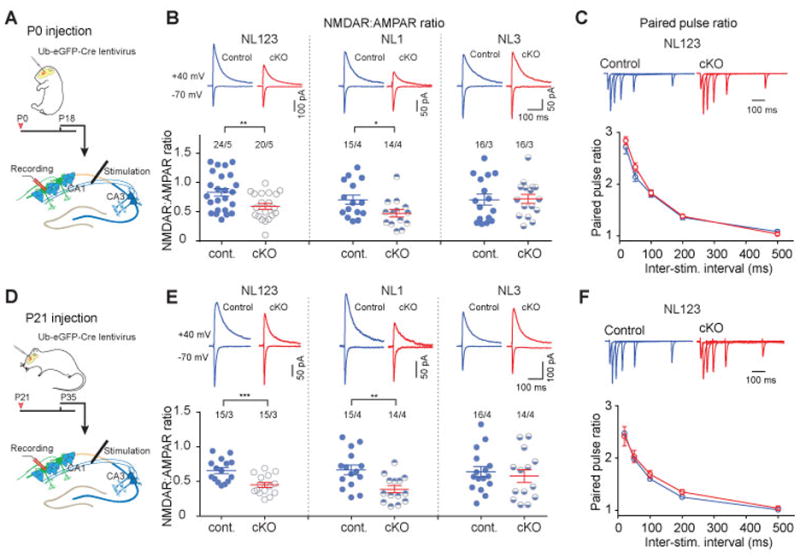
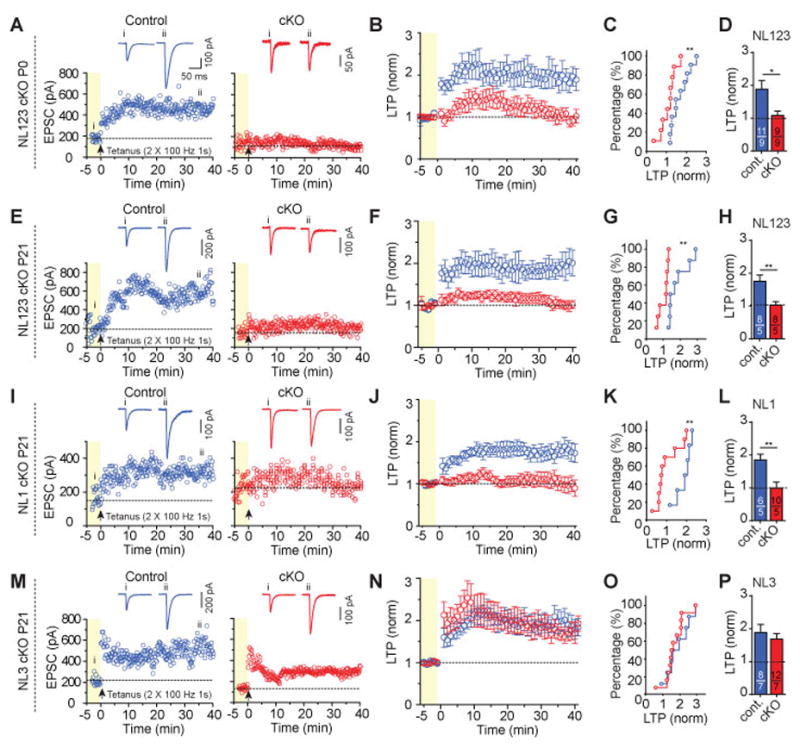
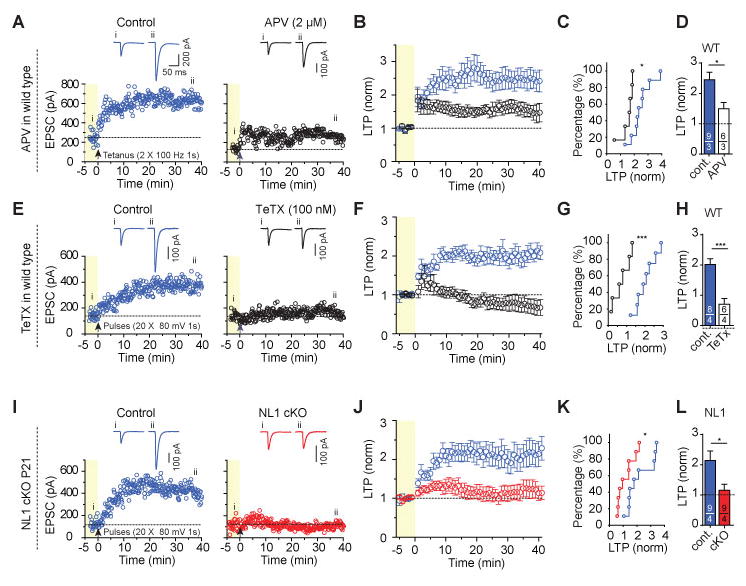
Neuroligins are postsynaptic cell-adhesion molecules implicated in autism and other neuropsychiatric disorders. Despite extensive work, the role of neuroligins in synapse function and plasticity, especially N-methyl-d-aspartate (NMDA) receptor (NMDAR)-dependent long-term potentiation (LTP), remains unclear. To establish which synaptic functions unequivocally require neuroligins, we analyzed single and triple conditional knockout (cKO) mice for all three major neuroligin isoforms (NL1-NL3). We inactivated neuroligins by stereotactic viral expression of Cre-recombinase in hippocampal CA1 region pyramidal neurons at postnatal day 0 (P0) or day 21 (P21) and measured synaptic function, synaptic plasticity and spine numbers in acute hippocampal slices 2-3 weeks later. Surprisingly, we find that ablation of neuroligins in newborn or juvenile mice only modestly impaired basal synaptic function in hippocampus and caused no alteration in postsynaptic spine numbers. However, triple cKO of NL1-NL3 or single cKO of NL1 impaired NMDAR-mediated excitatory postsynaptic currents and abolished NMDAR-dependent LTP. Strikingly, the NL1 cKO also abolished LTP elicited by activation of L-type Ca2+-channels during blockade of NMDARs. These findings demonstrate that neuroligins are generally not essential for synapse formation in CA1 pyramidal neurons but shape synaptic properties and that NL1 specifically is required for LTP induced by postsynaptic Ca2+-elevations, a function which may contribute to the pathophysiological role of neuroligins in brain disorders.


Conflict of interest statement

The authors declare no conflict of interest.

Figures

Figure 1
Figure 1. Sparse deletion of Neuroligins from hippocampal CA1 pyramidal neurons during postnatal development produces impairments in inhibitory but not fast excitatory synaptic transmission
(A) Schematic diagram of the NL cKO alleles. (B) Experimental design for injections at P0, followed by experimental analyses at postnatal P18–25. (C) Representative images of the hippocampus from a P0 injected mouse (left) and of sparsely infected CA1-region neurons (right; blue, DAPI; green, GFP). In all experiments, non-infected neurons served as controls for adjacent infected neurons in the same slices. (D) Analysis of mIPSCs in triple NL123 cKO neurons. Left, representative traces; middle, cumulative distribution of the mIPSC inter-event interval (inset: data points from individual cells and means of mIPSC frequency); right, cumulative distribution of mIPSC amplitudes (inset: data points from individual cells and mean mIPSC amplitudes). (E) vGAT staining in stratum pyramidale and stratum radiatum of hippocampal CA1 region. Left, low resolution images showing without (top, control) and with (bottom, cKO) robust infection of Ub-eGFP-Cre lentivirus, scale bar: 200 μm; Middle, high resolution images from the white box in control and cKO slices used for analysis, scale bar: 50 μm; Group data showing that the density of inhibitory synapses in stratum pyramidale and stratum radiatum of CA1 region was decreased in triple NL123 cKO. (F) Same as D, but for mEPSCs in triple NL123 cKO neurons. (G) NL123 deletion in newborn mice does not change the spine density of CA1 pyramidal cells. Left, representative images of biocytin-labeled CA1 pyramidal neurons after patch-clamp recording, with a lower and higher magnification images shown side by side (calibration bars: 50 μm and 2 μm, respectively); middle, cumulative distribution of spine density (control: 173 dendrites/22 neurons; cKO: 77 dendrites/10 NL123 cKO pyramidal neurons); right, summary graph of mean spine densities with data points from individual neurons. Data in summary graphs are means ± SEM; statistical comparisons were performed with the Kolmogorov-Smirnov test (cumulative distributions) or student’s t-test (*, p<0.05; **, p<0.01; ***, p<0.001; non-significant comparisons are not labeled). Numbers indicate number of cells/mice examined.
Figure 2
Figure 2. Sparse deletion of Neuroligins from mature hippocampal CA1 pyramidal neurons in juvenile mice causes similar but less severe phenotypes as deletions in developing neurons
(A) Experimental design for injections at P21, followed by experimental analyses from P35 onwards. (B) Analysis of mIPSCs in triple NL123 cKO neurons. Left, representative traces; middle, cumulative distribution of the mIPSC inter-event interval (inset: data points from individual cells and means of mIPSC frequency); right, cumulative distribution of mIPSC amplitudes (inset: data points from individual cells and mean mIPSC amplitudes). (C) Same as B, but for mEPSCs. (D) NL123 deletion in juvenile mice also does not change the spine density of CA1 pyramidal cells. Left, representative images of biocytin-stained CA1 pyramidal neurons after patch-clamp recording, with a lower and higher magnification images shown side by side (calibration bars: 50 μm and 2 μm, respectively); middle, cumulative distribution of spine density (control: 100 dendrites/13 neurons; cKO: 45 dendrites/6 NL123 cKO pyramidal neurons); right, summary graph of mean spine densities with data points from individual neurons. Data in summary graphs are means ± SEM; statistical comparisons were performed with the Kolmogorov-Smirnov test (cumulative distributions) or student’s t-test (*, p<0.05; **, p<0.01; ***, p<0.001; non-significant comparisons are not labeled). Numbers indicate number of cells/mice examined.
Figure 3
Figure 3. Single NL1 but not NL3 deletion significantly reduces NMDAR-mediated synaptic transmission in developing and juvenile CA1 pyramidal neurons
(A) Experimental design for conditional NL deletions in developing mice using P0 injections. (B) Measurements of the ratio of NMDAR- to AMPAR-mediated EPSCs in CA1 pyramidal neurons in triple NL123 cKO (left) and NL1 (middle) and NL3 single cKO mice (right). AMPAR-mediated EPSCs were quantified as peak EPSC amplitude monitored at -70 mV; NMDAR-mediated EPSCs were quantified as the EPSC amplitude at 50 ms after presynaptic stimulation monitored at +40 mV. Top, representative traces; bottom, summary plots of mean NMDAR/AMPAR ratios and the values from individual neurons (C) Paired pulse ratio (PPR) of EPSCs was not changed in triple NL123 cKO neurons. Top, representative traces; bottom, summary plot of mean PPRs as a function of the inter-stimulus interval (n = 16 control neurons/5 mice and 14 cKO neurons/5 mice, respectively). (D) Experimental design for conditional NL deletions in juvenile mice using P21 injections. (E) Same as B, but for juvenile mice. (F) Same as C, but for juvenile mice (n = 10 control neurons/3 mice and 10 cKO neurons/3 mice, respectively). Data in summary graphs are means ± SEM; statistical comparisons were performed with student’s t-test (*, p<0.05; **, p<0.01; ***, p<0.001; non-significant comparisons are not labeled). Numbers indicate number of cells/mice examined.
Figure 4
Figure 4. NL123 triple and NL1 single deletion but not NL3 deletion abolishes NMDAR-dependent LTP in CA1 pyramidal neurons
(A) Representative LTP experiments in a control (left) and NL123 cKO neuron (right) at P18 after lentiviral deletion of Neuroligins at P0. Top, sample traces; bottom, plots of the EPSC amplitude as a function of time before (yellow background) and after the LTP induction stimulus (2 trains of 100 Hz for 1 s with the cell depolarized to 0mV, separated by 20 s). (B) Summary plot of LTP shows LTP was completely blocked in triple NL123 cKO following P0 lentiviral injection. (C) Cumulative distribution of normalized LTP magnitud at 35-40 min after LTP induction. (D) Summary graph of the mean LTP magnitude at 35-40 min after LTP induction. (EH), same as (A–D), except for the triple NL123 cKO was induced by lentiviral infection of CA1 pyramidal neurons in juvenile mice at P21. (IL), same as (E–H), except for the NL1 single cKO at P21. (MP), same as (E–H), except for the NL3 single cKO at P21. Data in summary graphs are means ± SEM; statistical comparisons were performed with the Kolmogorov-Smirnov test (cumulative distributions) or student’s t-test (*, p<0.05; **, p<0.01; ***, p<0.001; non-significant comparisons are not labeled). Numbers indicate number of cells/mice examined.
Figure 5
Figure 5. NL1 cKO abolishes NMDAR-independent LTP in juvenile mice
(A) Representative LTP experiments in wild-type mice showing that partial inhibition of NMDARs with AP5 (2 μM) impairs, but does not block, LTP induced by a standard induction protocol (2 trains of 100 Hz for 1 s separated by 20 s). Top, sample traces; bottom, plots of the EPSC amplitude as a function of time before (yellow background) and after the LTP induction stimulus. (B) Summary plot of LTP in wild-type mice showing that this low dose of AP5 impaired, but did not block, LTP induced by a standard induction protocol. (C) Cumulative distribution of normalized LTP magnitude at 35–40 min after LTP induction for B. (D) Summary graph of the mean LTP magnitude at 35–40 min after LTP induction for B. (E) Representative LTP experiments in wild-type mice using an NMDAR-independent induction protocol and demonstrating that similar to NMDAR-dependent LTP, NMDAR-independent LTP is also inhibited by postsynaptic tetanus-toxin (TeTx) light chain (right, 100 nM tetanus-toxin in the pipette solution). LTP was induced by 20 postsynaptic depolarizations (80 mV, 1 s separated by 6 s) in the presence of 50 μM AP5 and 5 μM Bay K 8644 Top, sample traces; bottom, plots of the EPSC amplitude as a function of time before (yellow background) and after the LTP induction stimulus. (F) Summary plot of LTP induced by L-type Ca2+-channel mediated Ca2+-influx under continuous NMDAR-inhibition in control cells from wild-type mice, and its inhibition by tetanus toxin light chain. (G) Cumulative distribution of normalized LTP magnitude at 35–40 min after LTP induction for F. (H) Summary graph of the mean LTP magnitude at 35–40 min after LTP induction for F. (IL) Same as E–H, but comparing control neurons to NL1 cKO neurons produced by stereotactic lentiviral injection at P21. Data in summary graphs are means ± SEM; statistical comparisons were performed with the Kolmogorov-Smirnov test (cumulative distributions) or student’s t-test (*, p<0.05; **, p<0.01; ***, p<0.001; non-significant comparisons are not labeled). Numbers indicate number of cells/mice examined.

Similar articles

Cited by

References

    1. Sudhof TC. Neuroligins and neurexins link synaptic function to cognitive disease. Nature. 2008;455(7215):903–911. - PMC - PubMed
    1. Hu X, Luo J-h, Xu J. The interplay between synaptic activity and neuroligin function in the CNS. BioMed Research International. 2015;2015:13. - PMC - PubMed
    1. Bang M, Owczarek S. A matter of balance: Role of neurexin and neuroligin at the synapse. Neurochemical Research. 2013;38(6):1174–1189. - PubMed
    1. Huguet G, Ey E, Bourgeron T. The genetic landscapes of autism spectrum disorders. Annu Rev Genomics Hum Genet. 2013;14:191–213. - PubMed
    1. Jamain S, Quach H, Betancur C, Rastam M, Colineaux C, Gillberg IC, et al. Mutations of the X-linked genes encoding neuroligins NLGN3 and NLGN4 are associated with autism. Nat Genet. 2003;34(1):27–29. - PMC - PubMed

Publication types

MeSH terms