

Common and distinct patterns of grey-matter volume alteration in major depression and bipolar disorder: evidence from voxel-based meta-analysis
- PMID: 27217146
- PMCID: PMC5622121
- DOI: 10.1038/mp.2016.72
Common and distinct patterns of grey-matter volume alteration in major depression and bipolar disorder: evidence from voxel-based meta-analysis
Abstract
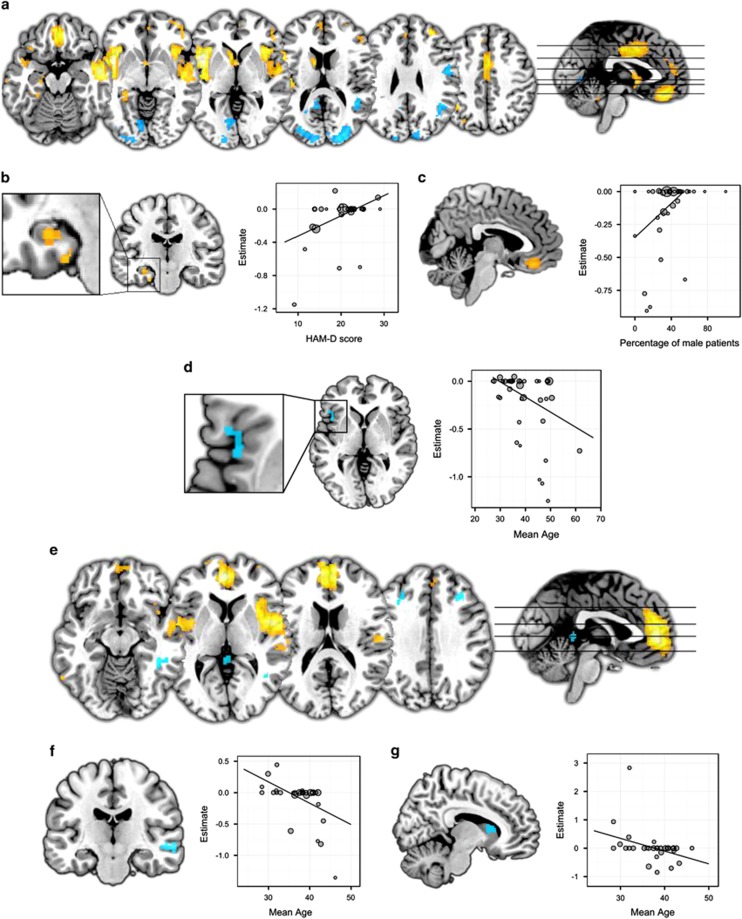
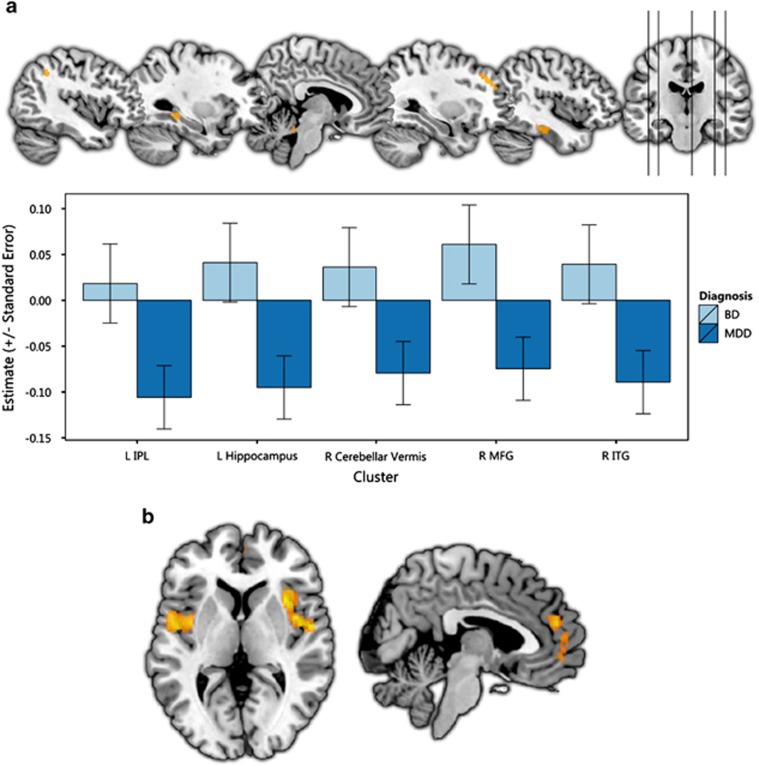
Finding robust brain substrates of mood disorders is an important target for research. The degree to which major depression (MDD) and bipolar disorder (BD) are associated with common and/or distinct patterns of volumetric changes is nevertheless unclear. Furthermore, the extant literature is heterogeneous with respect to the nature of these changes. We report a meta-analysis of voxel-based morphometry (VBM) studies in MDD and BD. We identified studies published up to January 2015 that compared grey matter in MDD (50 data sets including 4101 individuals) and BD (36 data sets including 2407 individuals) using whole-brain VBM. We used statistical maps from the studies included where available and reported peak coordinates otherwise. Group comparisons and conjunction analyses identified regions in which the disorders showed common and distinct patterns of volumetric alteration. Both disorders were associated with lower grey-matter volume relative to healthy individuals in a number of areas. Conjunction analysis showed smaller volumes in both disorders in clusters in the dorsomedial and ventromedial prefrontal cortex, including the anterior cingulate cortex and bilateral insula. Group comparisons indicated that findings of smaller grey-matter volumes relative to controls in the right dorsolateral prefrontal cortex and left hippocampus, along with cerebellar, temporal and parietal regions were more substantial in major depression. These results suggest that MDD and BD are characterised by both common and distinct patterns of grey-matter volume changes. This combination of differences and similarities has the potential to inform the development of diagnostic biomarkers for these conditions.
Conflict of interest statement
AJC has within the last 3 years received honoraria for speaking from Astra Zeneca and Pfizer; and received research grant support from Lundbeck. MLP is a consultant for Roche Pharmaceuticals. GS is employed by Janssen Pharmaceuticals. DA has received travel grants from Janssen-Cilag and Servier. The remaining authors declare no conflicts of interest.
Figures
References
-
- Kessler RC, Berglund P, Demler O, Jin R, Koretz D, Merikangas KR et al. The epidemiology of major depressive disorder: results from the National Comorbidity Survey Replication (NCS-R). J Am Med Assoc 2003; 289: 3095–3105. - PubMed
-
- Botteron K, Carter C, Castellanos FX, Dickstein DP, Drevets W, Kim KL et al. Consensus report of the APA work group on neuroimaging markers of psychiatric disorders. Am Psychiatr Assoc 2012.
-
- Fu CHY, Costafreda SG. Neuroimaging-based biomarkers in psychiatry: clinical opportunities of a paradigm shift. Can J Psychiatry 2013; 58: 499–508. - PubMed
Publication types
MeSH terms
Grants and funding
- DH_/Department of Health/United Kingdom
- G0802594/MRC_/Medical Research Council/United Kingdom
- G0502157/MRC_/Medical Research Council/United Kingdom
- G0400074/MRC_/Medical Research Council/United Kingdom
- G1100540/MRC_/Medical Research Council/United Kingdom
- R01 MH073953/MH/NIMH NIH HHS/United States
- P50 MH106435/MH/NIMH NIH HHS/United States
- R01 MH060952/MH/NIMH NIH HHS/United States
- 104036/WT_/Wellcome Trust/United Kingdom
- MR/K026992/1/MRC_/Medical Research Council/United Kingdom
- MR/J008915/1/MRC_/Medical Research Council/United Kingdom
- G0900652/MRC_/Medical Research Council/United Kingdom
LinkOut - more resources
Full Text Sources
Other Literature Sources
Medical
