Clinical Trial
. 2016 May 30;213(6):1061-77.
doi: 10.1084/jem.20151025. Epub 2016 May 23.

Interferon-driven alterations of the host's amino acid metabolism in the pathogenesis of typhoid fever

Affiliations
Clinical Trial

Interferon-driven alterations of the host's amino acid metabolism in the pathogenesis of typhoid fever

Christoph J Blohmke et al. J Exp Med. .

Abstract

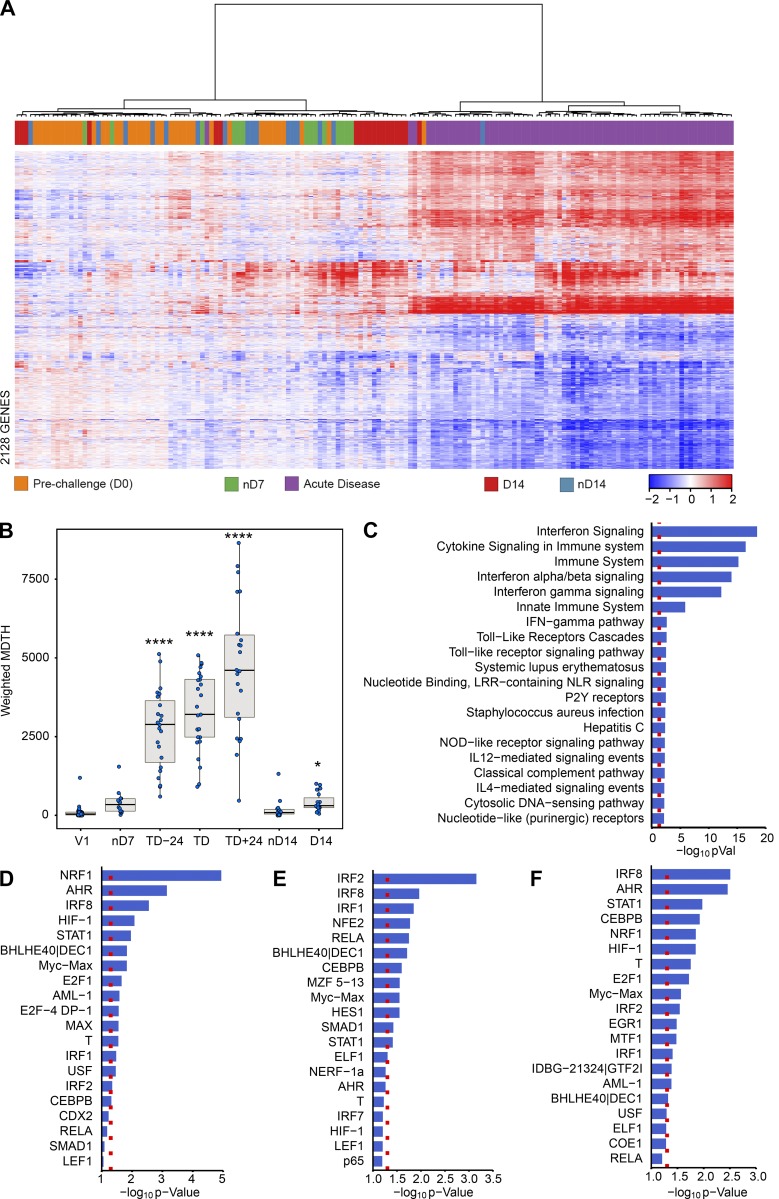
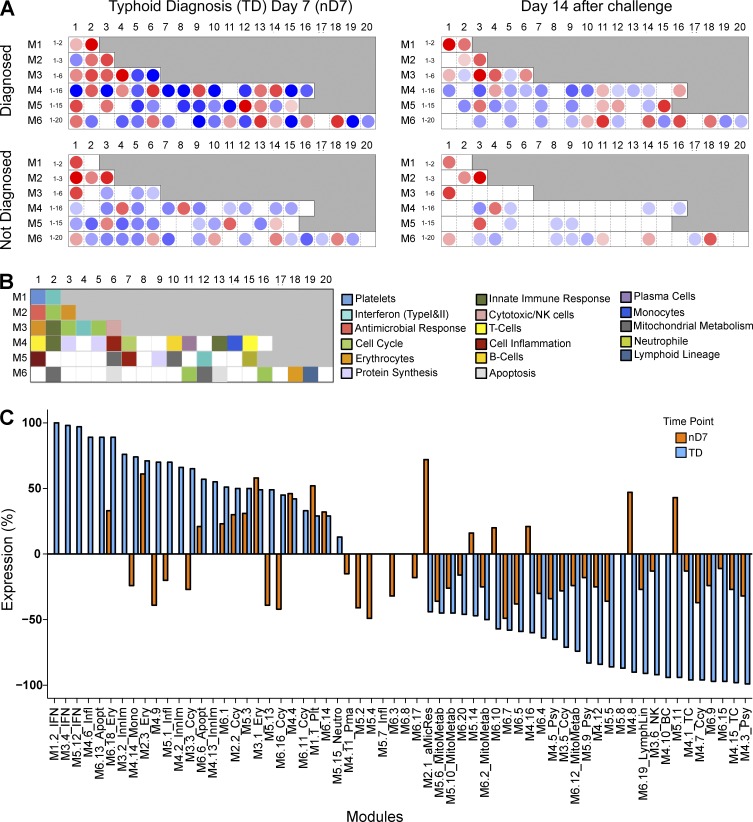
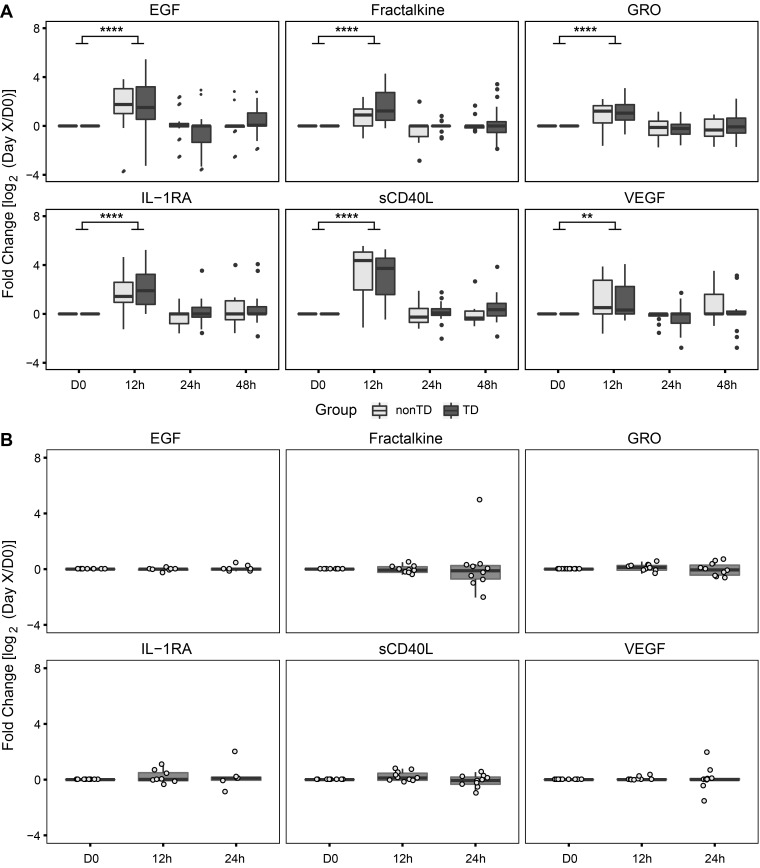
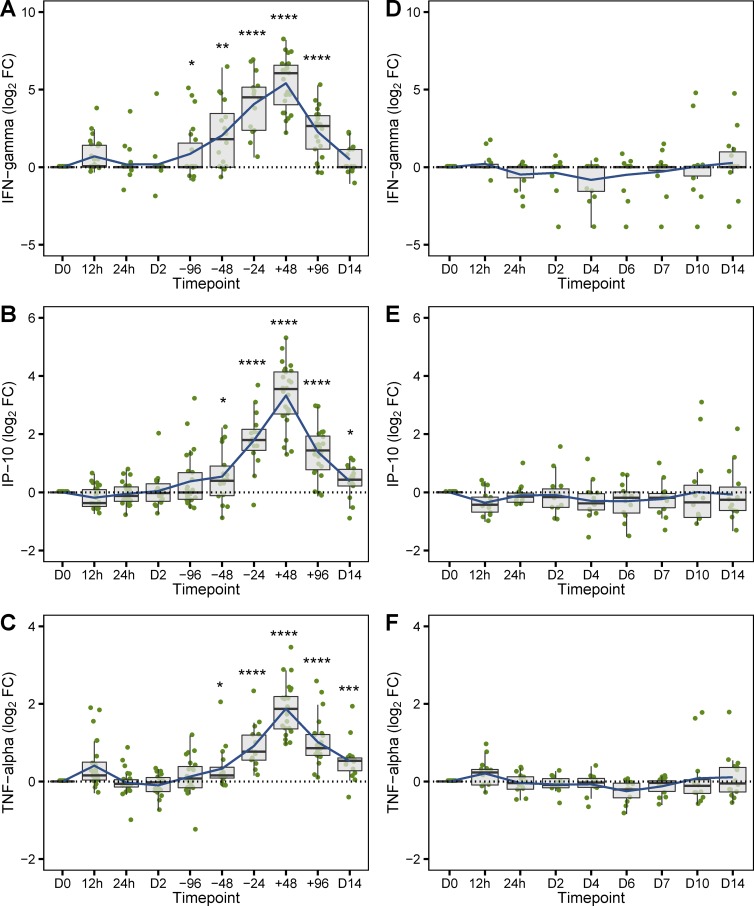
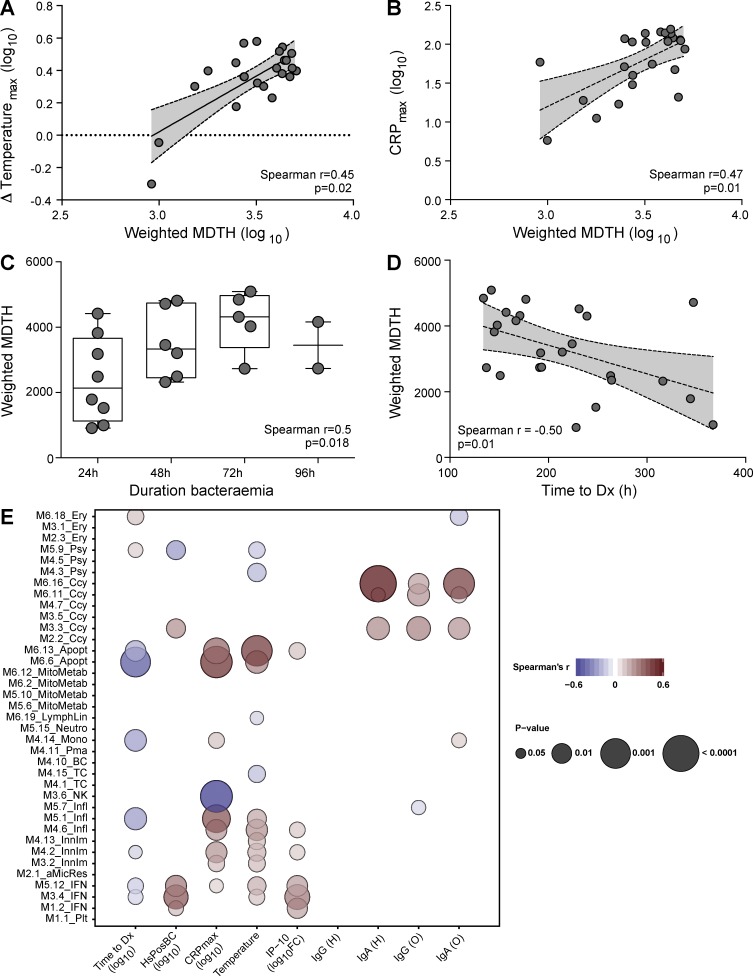
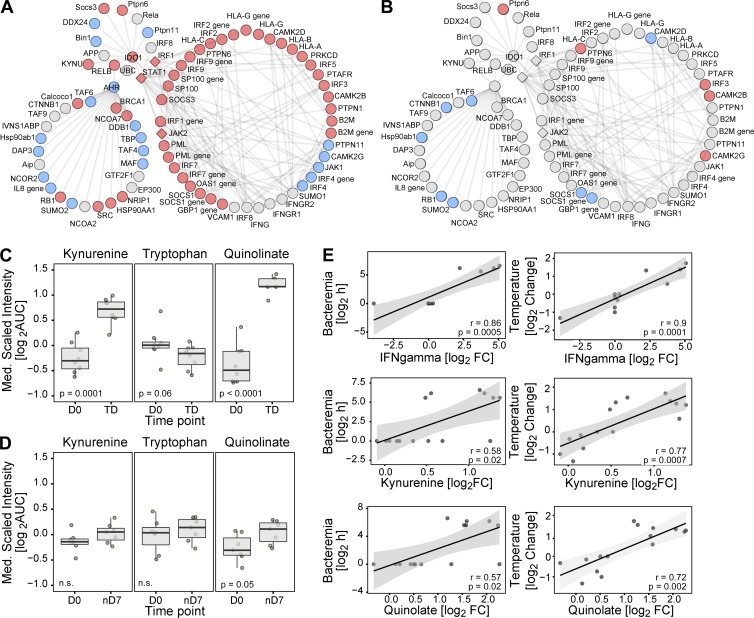
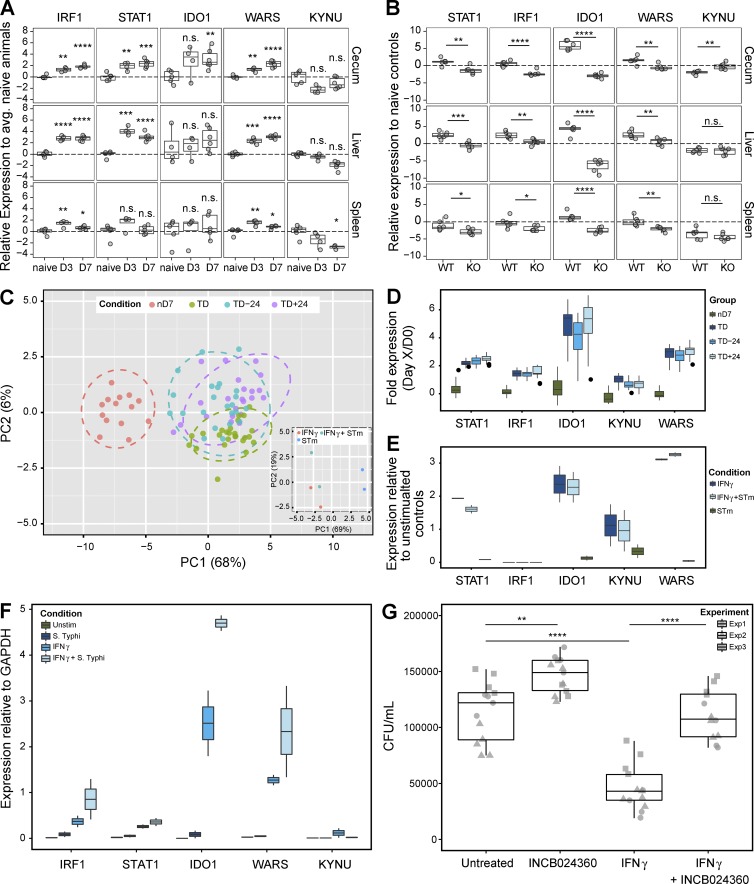
Enteric fever, caused by Salmonella enterica serovar Typhi, is an important public health problem in resource-limited settings and, despite decades of research, human responses to the infection are poorly understood. In 41 healthy adults experimentally infected with wild-type S. Typhi, we detected significant cytokine responses within 12 h of bacterial ingestion. These early responses did not correlate with subsequent clinical disease outcomes and likely indicate initial host-pathogen interactions in the gut mucosa. In participants developing enteric fever after oral infection, marked transcriptional and cytokine responses during acute disease reflected dominant type I/II interferon signatures, which were significantly associated with bacteremia. Using a murine and macrophage infection model, we validated the pivotal role of this response in the expression of proteins of the host tryptophan metabolism during Salmonella infection. Corresponding alterations in tryptophan catabolites with immunomodulatory properties in serum of participants with typhoid fever confirmed the activity of this pathway, and implicate a central role of host tryptophan metabolism in the pathogenesis of typhoid fever.


Figures

Figure 1.
Figure 1.
Transcriptional signatures associated with acute typhoid fever. (A) Unsupervised clustering of genes differentially expressed in samples derived in participants diagnosed or not diagnosed with typhoid after challenge. Color bar represents time points: nD7 (n = 14, green) and nD14 (n = 15, blue) in participants not diagnosed with typhoid; TD-24 h (n = 23), TD (n = 25), and TD+24 h (n = 22; acute disease, purple) and D14 (n = 19; red) in diagnosed participants. (B) MDTH scores based on the expression of the genes displayed in A. *, P < 0.05; ****, P < 0.0001 compared with challenge baselines (D0) using Kruskal-Wallis test with Dunn’s correction for multiple testing. (C) Top 20 most significant pathways overrepresented at TD (n = 25). (D–F) Top 20 most significantly differentially expressed transcription factors at TD-24 h (n = 23; D), TD (n = 25; E), and TD+24 h (n = 22; F; red dotted line, P = 0.05). Euclidean distance clustering using the ward algorithm (A). Data are median with 25th/75th percentile (B).
Figure 2.
Figure 2.
Modular analysis of the acute typhoid transcriptome. (A) Modular maps were constructed at each time point separately as described in Materials and methods. Red or blue coloration indicates the proportion of over- or under-expressed transcripts (P < 0.05, unpaired Student’s t test) contained in each module, respectively (white, not expressed; blue, underexpressed; red, overexpressed). (top) Diagnosed participants at TD (n = 25) and D14 (n = 19); (bottom) participants who stayed well at nD7 (n = 14) and nD14 (n = 15). (B) Modular map annotation key. (C) Modular expression (in % significant genes) of each module was plotted ordered according to expression (positive to negative) at time of diagnosis (TD).
Figure 3.
Figure 3.
Plasma cytokine profiles within hours after challenge. Cytokine induction [log2 FC/D0] at prechallenge (D0), 12, 24, and 48 h after challenge in participants who were diagnosed (n = 25, dark gray) or stayed well (n = 16, light gray) after challenge with S. Typhi (A). Cytokine induction [log2 FC/D0] at 12 h, 24 h after ingestion of sodium bicarbonate solution (n = 10; B). Data are median with 25th/75th percentile and run in duplicates. **, P < 0.01; ****, P < 0.0001; using unpaired Student’s t test (Table S4).
Figure 4.
Figure 4.
Longitudinal plasma cytokine profiles of participants challenged with S. Typhi. Longitudinal cytokine response profiles [log2 FC/D0] for participants developing typhoid fever (A–C, n = 25) and those who were not diagnosed after challenge (D–F, n = 16). Data are median with 25th/75th percentile, and blue line depicts the mean. Each sample was run in duplicates. *, P < 0.05; **, P < 0.01; ***, P < 0.001; ****, P < 0.0001 using one-sample Student’s t test.
Figure 5.
Figure 5.
Relationships among the blood transcriptome to clinically relevant outcomes. Spearman rank’s correlation analysis of weighted MDTH scores with (A) ΔTemperature (maximum change from baseline, n = 24), (B) maximum CRP (n = 24), (C) duration of bacteremia (in hours; n = 21), and (D) time-to-diagnosis (in hours; n = 25) in participants diagnosed with acute typhoid fever. (E) Modular expression (log10 FC) was calculated for each participant and correlated (Spearman’s rank correlation) with clinical and immunobiological outcome measures. Red, positive correlation; blue, negative correlation; bubble size represents correlation p-values.
Figure 6.
Figure 6.
IFN–tryptophan interactome and metabolites after challenge. (A and B) Custom IFNtryptophan metabolism interactome superimposed with the gene expression during acute disease (mean expression of TD-24 h [n = 23], TD [n = 25], and TD+24 h [n = 22]; A) and day 7 after challenge in those not diagnosed after challenge (nD7; n = 16; B). Kynurenine, tryptophan, and quinolinate changes from prechallenge control samples in participants diagnosed with typhoid (TD; n = 8; C) and those who stayed well (nD7; n = 7; D). (E) Spearman’s rank correlation of microbiological (bacteremia in hours) and clinical outcome parameters (ΔTemperaturemax) with IFN-γ (plasma cytokine; n = 10–11), kynurenine (n = 15), and quinolate (n = 15). Data are mean and 25th/75th percentile and samples were run in duplicates. Statistical differences were determined using paired Student’s t test (C and D).
Figure 7.
Figure 7.
IFNγ-mediated IDO1 expression in vivo. (A) Gene expression was measured in spleen, cecum, and liver of WT mice at D0 (n = 5), day 3 (n = 4), and day 7 (n = 6) after infection. (B) Gene expression was measured in spleen, cecum, and liver when WT (n = 6) and IFN-γR−/− (n = 6) mice experiencing 12% weight loss PI. (C) Gene expression (log2 FC) of the IFNtryptophan signaling network genes at day 7 (n = 16) and TD−24 h (n = 23), TD (n = 25), and TD+24 h (n = 22) in those who stayed well or were diagnosed after infection. (C, inset) Protein expression (log2 FC) in IFN-γ–primed macrophages alone (IFN; two independent experiments), infected with S. Typhimurium (IFN+STm; two independent experiments), or unprimed macrophages infected with Salmonella (STm; two independent experiments). Target gene (D) or protein (E) expression (log2 FC) in whole blood of participants challenged with S. Typhi (nD7, n = 16; TD-24, n = 23; TD, n = 25; TD+24, n = 22) and macrophages stimulated with S. Typhimurium (two independent experiments), respectively. (F) Gene expression (log2 FC) of macrophages alone (unstim), infected with S. Typhi BRD948 (S. Typhi), IFN-γ–primed macrophages (IFN-γ), and INF-γ–primed and S. Typhi infected (IFNγ+BRD; two independent experiments/condition). (G) Unprimed macrophages were infected with S. Typhi BRD and IDO1 inhibitor alone (INCB024360), after IFN-γ–priming (INF-γ), after IFN-γ priming and IDO1 inhibition (IFNγ+INCB024360) or alone (untreated), and bacterial counts were determined (three independent experiments/condition). At least three mice per group and time point were analyzed (A and B). Circles represent 95% CI (C). Data are mean FC over appropriate controls with 25th/75th percentile (A, B, and D–G). At least two independent experiments (C, inset, and E–G) with at least two biological repeats were performed. Q-PCRs were run in duplicates. *, P < 0.05; **, P < 0.01; ***, P < 0.001; ****, P < 0.0001 using unpaired Student’s t tests.

References

    1. Banchereau R., Jordan-Villegas A., Ardura M., Mejias A., Baldwin N., Xu H., Saye E., Rossello-Urgell J., Nguyen P., Blankenship D., et al. . 2012. Host immune transcriptional profiles reflect the variability in clinical disease manifestations in patients with Staphylococcus aureus infections. PLoS One. 7:e34390 10.1371/journal.pone.0034390 - DOI - PMC - PubMed
    1. Beck P.L., and Podolsky D.K.. 1999. Growth factors in inflammatory bowel disease. Inflamm. Bowel Dis. 5:44–60. 10.1097/00054725-199902000-00007 - DOI - PubMed
    1. Blumenthal A., Nagalingam G., Huch J.H., Walker L., Guillemin G.J., Smythe G.A., Ehrt S., Britton W.J., and Saunders B.M.M.. 2012. M. tuberculosis induces potent activation of IDO-1, but this is not essential for the immunological control of infection. PLoS One. 7:e37314 10.1371/journal.pone.0037314 - DOI - PMC - PubMed
    1. Bucasas K.L., Franco L.M., Shaw C.A., Bray M.S., Wells J.M., Niño D., Arden N., Quarles J.M., Couch R.B., and Belmont J.W.. 2011. Early patterns of gene expression correlate with the humoral immune response to influenza vaccination in humans. J. Infect. Dis. 203:921–929. 10.1093/infdis/jiq156 - DOI - PMC - PubMed
    1. Chaussabel D., and Baldwin N.. 2014. Democratizing systems immunology with modular transcriptional repertoire analyses. Nat. Rev. Immunol. 14:271–280. 10.1038/nri3642 - DOI - PMC - PubMed

Publication types