. 2016 Jun 7;113(23):6520-5.
doi: 10.1073/pnas.1606276113. Epub 2016 May 23.

Developmental cell death programs license cytotoxic cells to eliminate histocompatible partners

Affiliations

Developmental cell death programs license cytotoxic cells to eliminate histocompatible partners

Daniel M Corey et al. Proc Natl Acad Sci U S A. .

Abstract

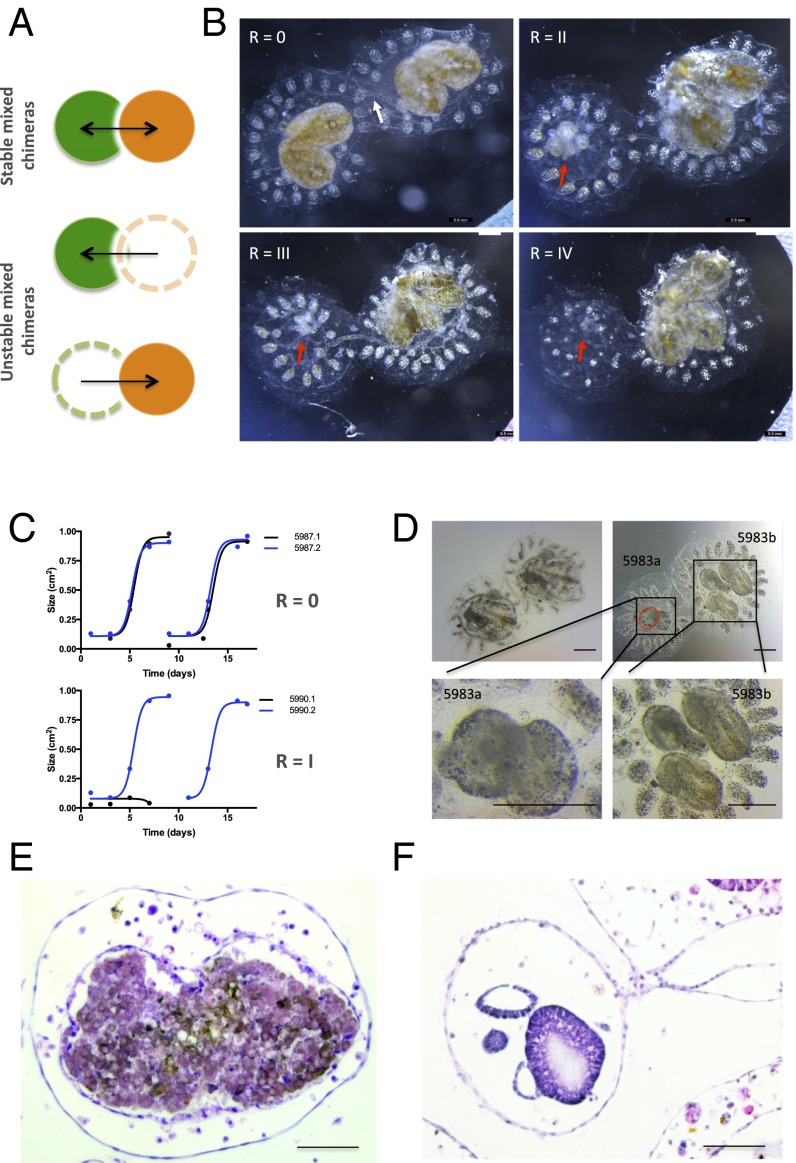
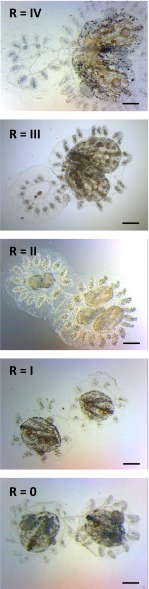
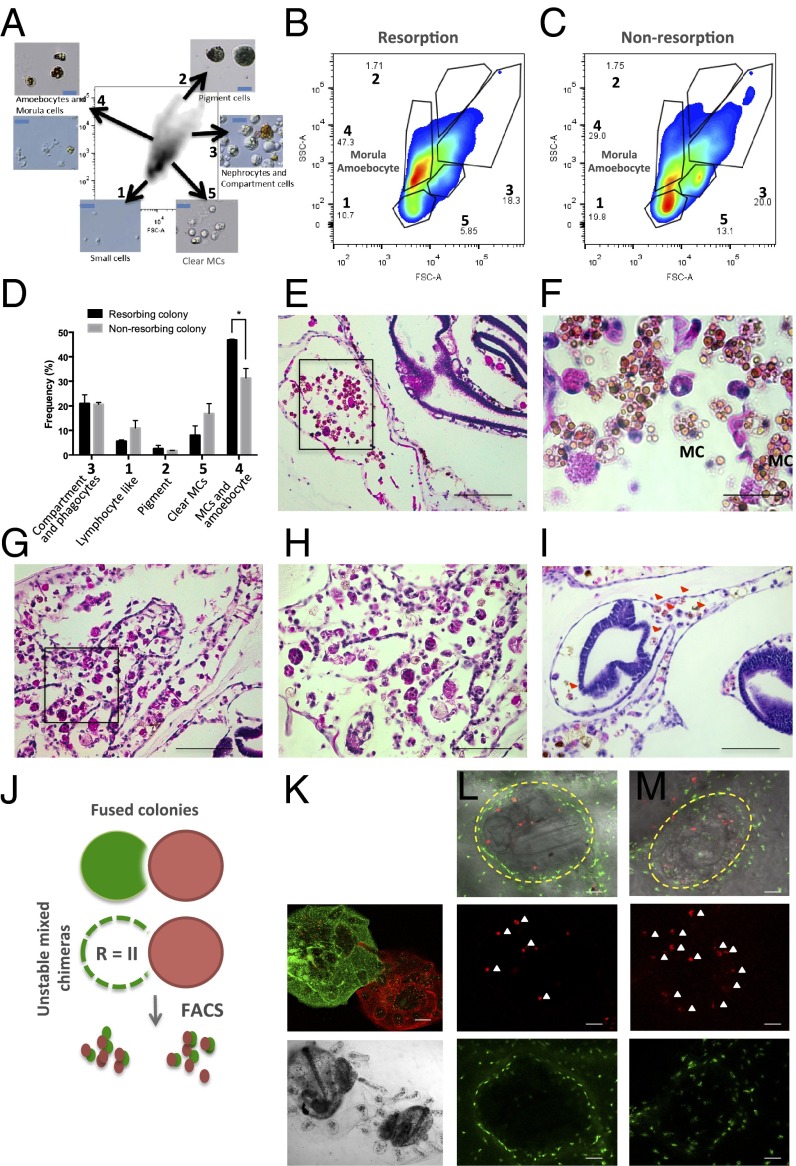
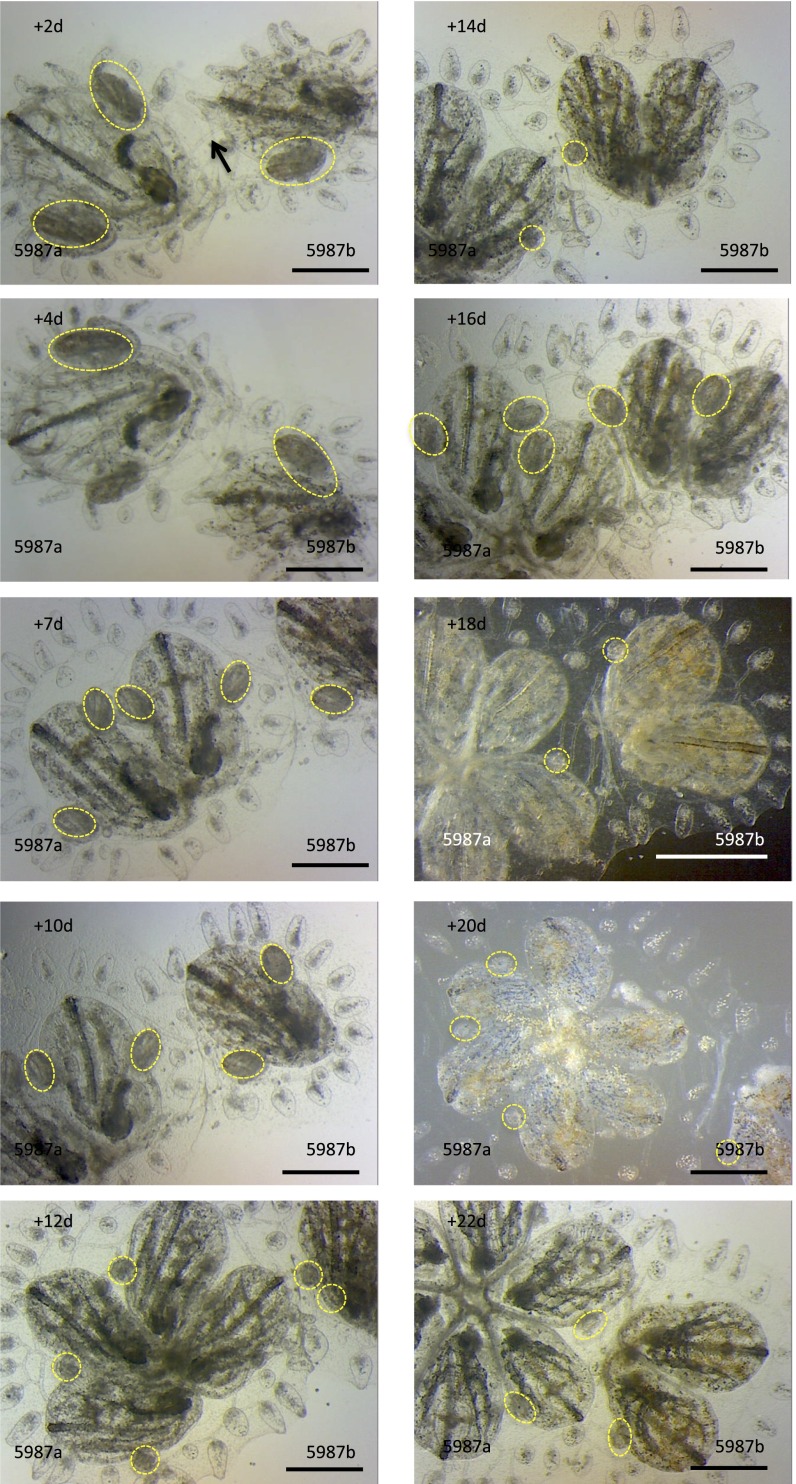
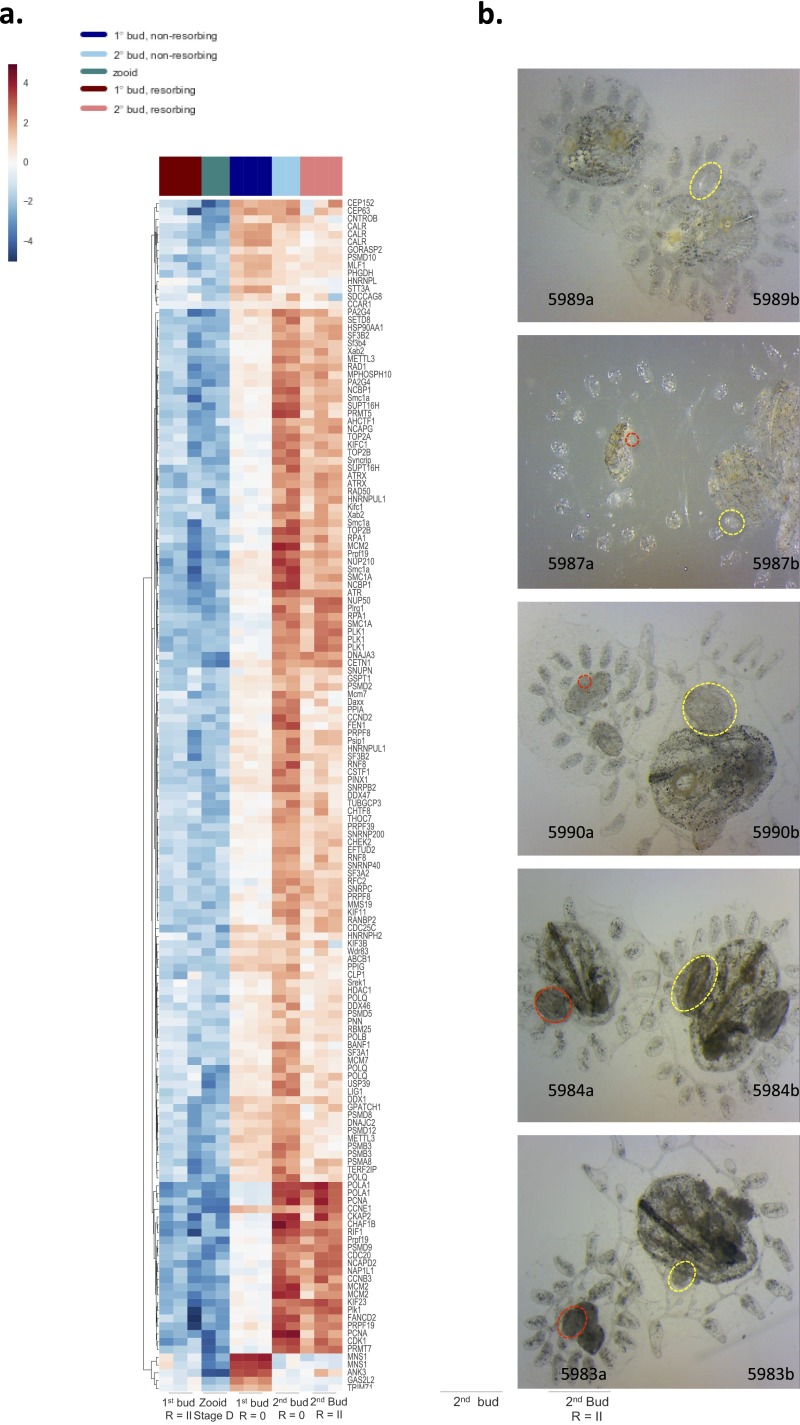
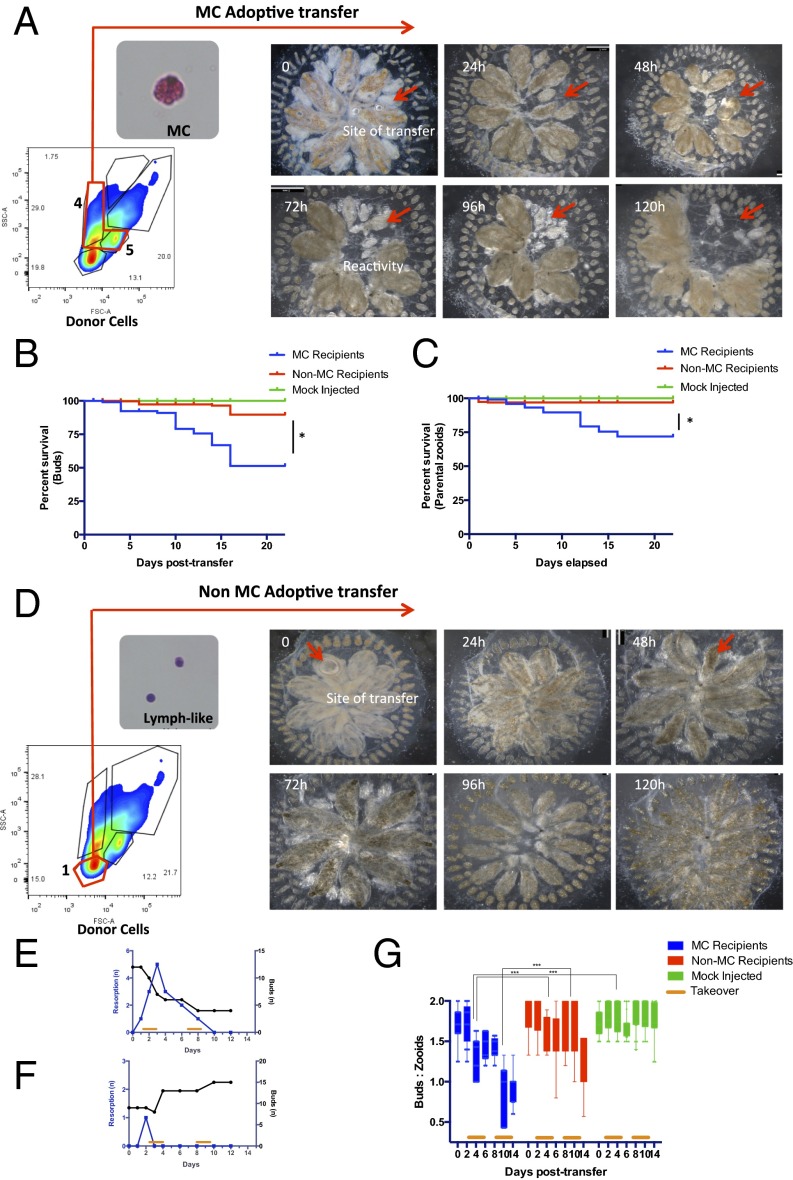
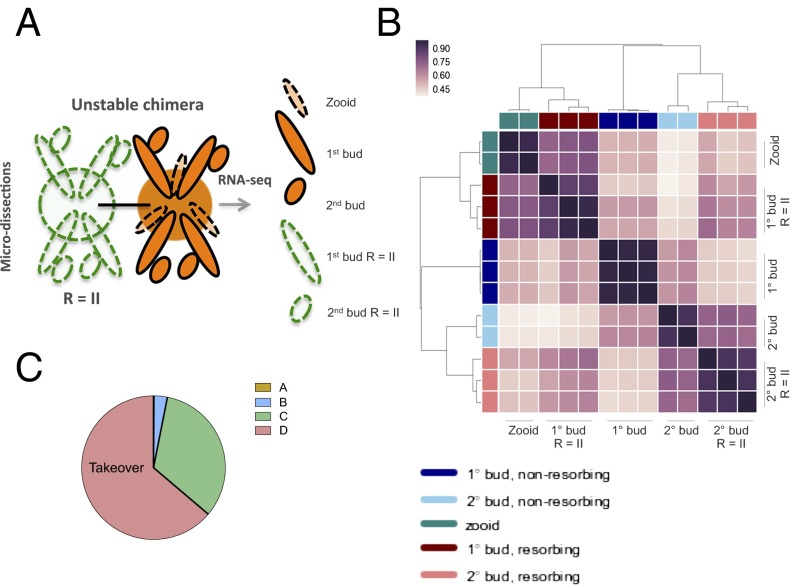
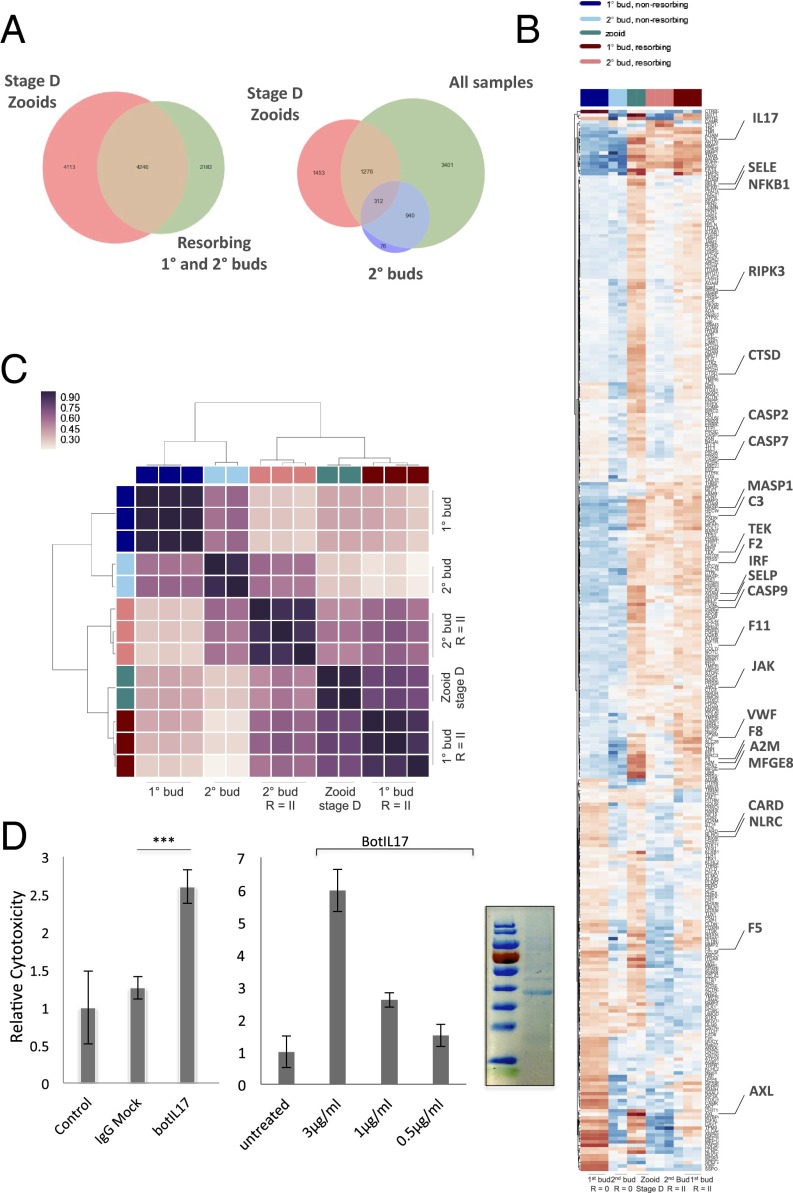
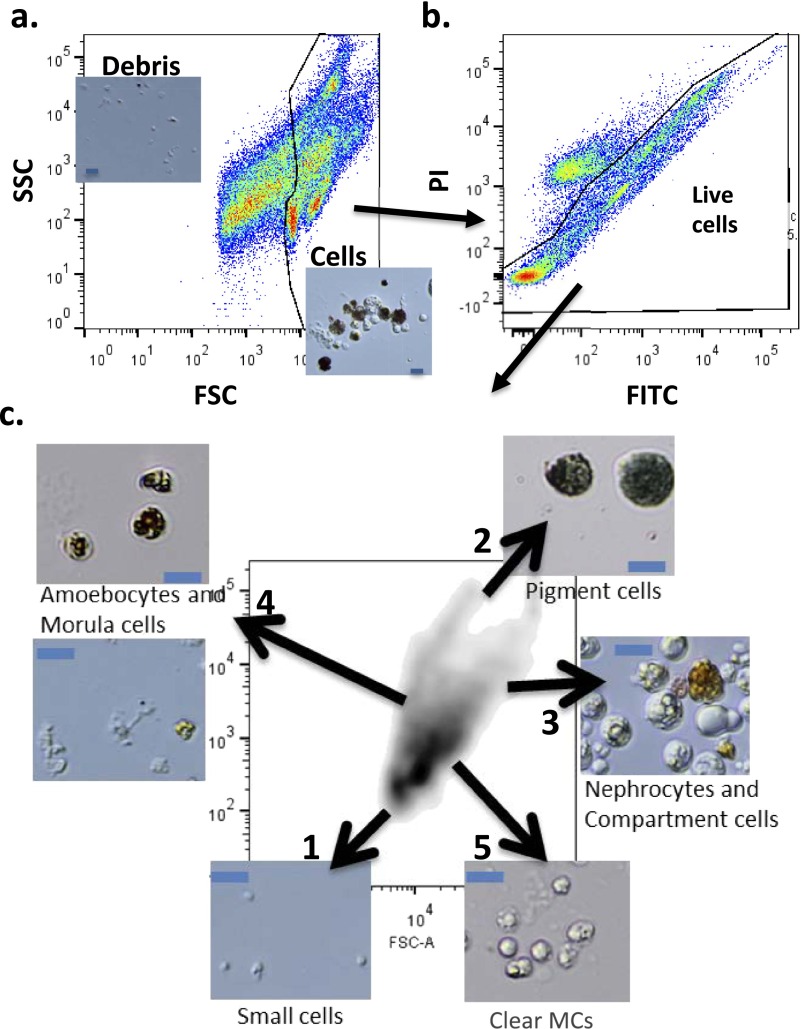
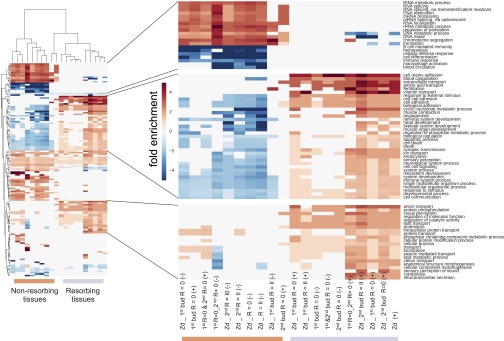
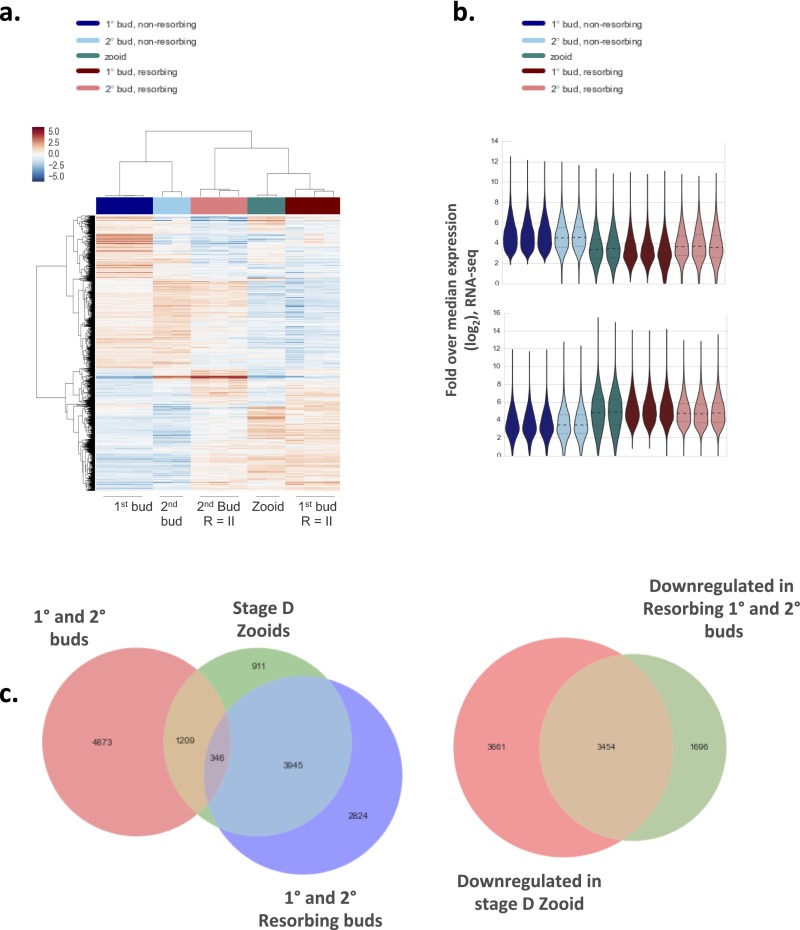
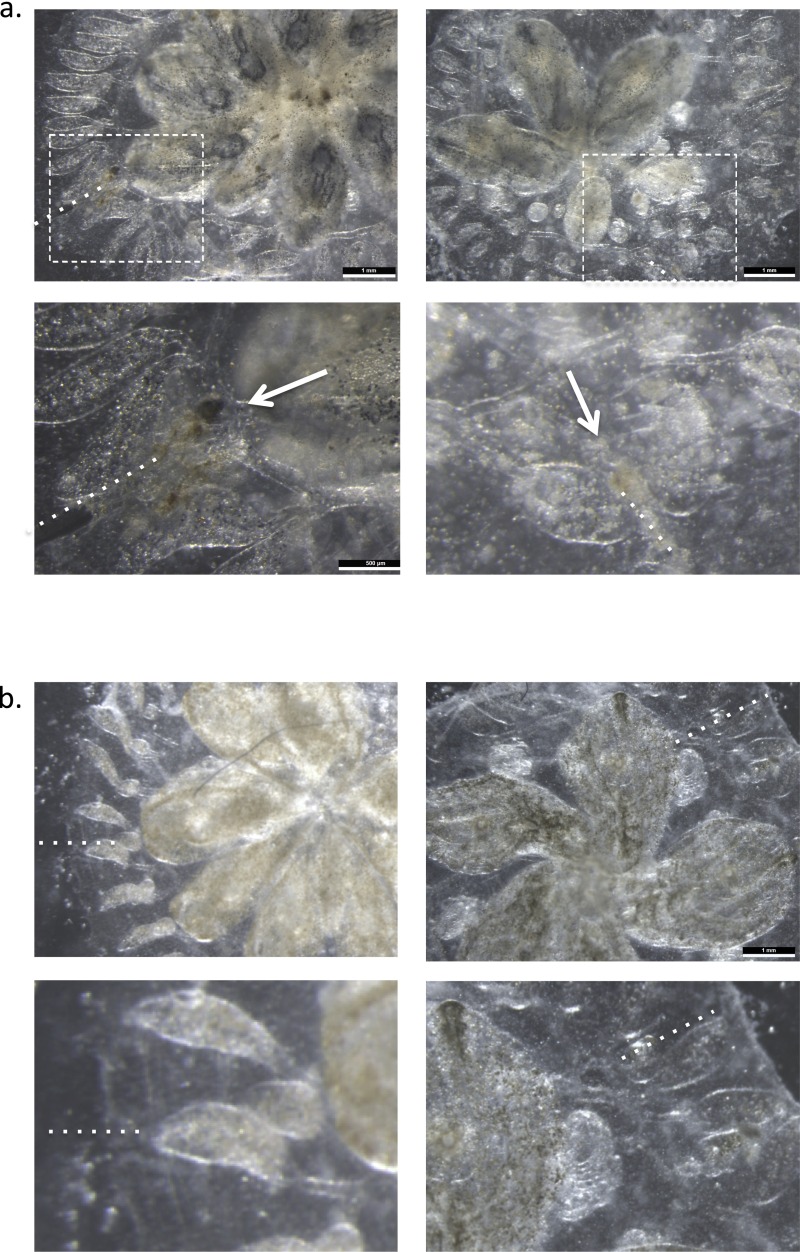
In a primitive chordate model of natural chimerism, one chimeric partner is often eliminated in a process of allogeneic resorption. Here, we identify the cellular framework underlying loss of tolerance to one partner within a natural Botryllus schlosseri chimera. We show that the principal cell type mediating chimeric partner elimination is a cytotoxic morula cell (MC). Proinflammatory, developmental cell death programs render MCs cytotoxic and, in collaboration with activated phagocytes, eliminate chimeric partners during the "takeover" phase of blastogenic development. Among these genes, the proinflammatory cytokine IL-17 enhances cytotoxicity in allorecognition assays. Cellular transfer of FACS-purified MCs from allogeneic donors into recipients shows that the resorption response can be adoptively acquired. Transfer of 1 × 10(5) allogeneic MCs eliminated 33 of 78 (42%) recipient primary buds and 20 of 76 (20.5%) adult parental adult organisms (zooids) by 14 d whereas transfer of allogeneic cell populations lacking MCs had only minimal effects on recipient colonies. Furthermore, reactivity of transferred cells coincided with the onset of developmental-regulated cell death programs and disproportionately affected developing tissues within a chimera. Among chimeric partner "losers," severe developmental defects were observed in asexually propagating tissues, reflecting a pathologic switch in gene expression in developmental programs. These studies provide evidence that elimination of one partner in a chimera is an immune cell-based rejection that operates within histocompatible pairs and that maximal allogeneic responses involve the coordination of both phagocytic programs and the "arming" of cytotoxic cells.

Keywords: apoptosis; histocompatibility; inflammation; innate immunity; macrophages.


Conflict of interest statement

The authors declare no conflict of interest.

Figures

Fig. 1.
Fig. 1.
Effect of allogeneic resorption on asexual propagation. (A) Depiction of controlled fusion reactions among compatible, yet genetically distinct, fused partners that result in resorption of one partner (depicted with dotted lines). (B) Time lapse imaging of a juvenile fused chimera (white arrow depicts blood vessel anastomosis between two colonies) undergoing resorption. Images were acquired at 24-h intervals starting 5 d after fusion. Moderate tissue destruction (red arrow) was first observed 6 d after fusion (Top Right) and progressed to complete stage R = IV resorption within 72 h (Bottom Right) during the takeover period (stage D) of blastogenesis (nonresorbing colony, Bottom Left). (C) Growth curves (cm2) of primary buds in a stable chimera (depicted as blue and black lines) exhibit synchronized cycles of expansion and regression (Top). Unstable chimeras exhibit growth arrest in asexually propagating tissues (Bottom). (D) High power magnification of abnormal zooids and buds (Top Right, red dotted lines) in allogeneic resorbing colonies compared with nonresorbing colonies (Top Left). (Scale bars: Top, 500 μM; Bottom, 100 μM.) (E) Hematoxylin/eosin (H&E)-stained tissue section of a resorbing 1° bud showing effacement of developing structures with associated destructive changes and infiltration of cytotoxic and phagocytic cell populations compared with nonresorbing buds of the same developmental stage as in F. (Scale bars: Left, 200 μM; Right, 100 μM.)
Fig. S1.
Fig. S1.
Resorption classification. Representative images of fused pairs undergoing allogeneic resorption and graded according to severity. Resorption status was graded on a 0 to IV scale: (Bottom) Stage 0 (no resorption observed); (Second From Bottom) stage I (mild resorption = zooid contraction); (Middle) stage II (moderate resorption = zooid contraction, 1° and 2° bud developmental arrest, chimeric blastogeneic asynchrony, residual cardiac activity); (Second From Top) stage III (severe resorption = only remnants visible, no cardiac activity); and (Top) stage IV (complete resorption = one partner has been fully eliminated; only supporting tissue (ampullae, blood vessels, and tunic) remain). (Scale bars: 2 mm.)
Fig. 2.
Fig. 2.
Profiling the cellular composition of allogeneic resorbing colonies. (A) B. schlosseri cell populations were analyzed and sorted using FACS according to their intrinsic size (FSC) and granularity (SSC) properties on log scale. Using this approach, we identified five populations of cells: 1, small lymphocyte-like cells; 2, pigment cells; 3, large phagocytes, nephrocytes, and compartment cells; 4, dark vacuolated morula cells (MCs) and amoebocytes; 5, clear MCs. In captions are representative images of sorted populations. (Blue scale bars: 20 µm.) (B and C) Representative FACS plots from a nonresorbing and resorbing partner. An increase in frequency of cells with intermediate/high side scatter (SSC), low forward scatter (FSC) was observed in resorbing partners (population 4). (D) Cellular composition of allogeneic resorbing and nonresorbing colonies; as above, significant increase of MCs and amoebocytes was observed in resorption (ANOVA, P < 0.05). (E and F) H&E-stained tissues show pronounced infiltration of MCs and prominent phagocytic infiltration, indicating severe allogeneic resorption. (Scale bars: Left, 200 μM; Right, 100 μM.) (G and H) H&E-stained tissues at the time of takeover show heavy infiltration of macrophages, but limited numbers of MCs. (I) Developing structures are infiltrated by allogeneic partner cells (red arrows). (J) Schematic of live cell fluorescent imaging of labeled colonies to identify source of infiltrating cells. (KM) Partner cells traffic into developing buds (outlined in yellow). Allogeneic red cells (white arrows) infiltrate green-labeled colonies.
Fig. S2.
Fig. S2.
Stable, mixed chimeras exhibit synchronized cycles of death and regeneration. Histocompatible, but genetically distinct, juvenile colonies were brought together in controlled allorecognition reactions (arrow indicates anastomotic blood vessel) and imaged in the postfusion period at 48-h intervals. Colonies grow through weekly cycles of development termed blastogenesis. New buds emerge (yellow, dotted outlines) from the body wall of each parental zooid. Chimeric partners exhibit developmental synchrony with each other. (Scale bars: 2 mm.)
Fig. S3.
Fig. S3.
Effects of allogeneic resorption on developmental signaling. (A) Heat map and hierarchical clustering analysis among GO term developmental gene sets (GO terms: chromosome organization, cell cycle, RNA splicing, and DNA replication). Each gene is represented by a single row in the heat map; the color scale ranges from −5 to 5 cpm (blue, low; red, high). Aberrant developmental gene expression profiles are observed across both allogeneic resorbing 1° and 2° buds. (B) Representative images of fused pairs undergoing allogeneic resorption (red circles indicate abnormal developing primary and secondary buds; yellow circles indicate normal buds).
Fig. 3.
Fig. 3.
Cellular transfer of FACS-purified allogeneic MCs shows that the resorption response can be adoptively acquired. (A) Allogeneic MCs were prospectively isolated by FACS (populations 4 and 5), transferred via ampullar injection into recipients, and followed for features of allogeneic resorption. (Top) Time lapse imaging over 24-h intervals of a recipient colony after receiving 1 × 10⁵ allogeneic MCs (red arrow indicates site of cellular transfer, followed by parental zooid and bud elimination). (B and C) Kaplan–Meir survival curves among recipient colonies show that transfer of allogeneic MCs eliminates recipient primary buds and zooids compared with non-MC and mock injected groups (P < 0.0001 by Log-rank test). (D) Transfer of 1 × 10⁵ allogeneic control MC-less cells (small lymphocyte-like cell; population 1) had only minimal effects on recipient colonies. (E and F) Timing of bud and parental zooid loss in representative MC (E) and non-MC (F) recipients. (G) Box and whisker plots among groups showing the ratio of buds to parental zooids over time. Transfer of allogeneic MCs eliminates recipient primary buds, resulting in a decline in the bud-to-zooid ratio from 1.7 (±0.03) to 0.9 (±0.06) (P = 0.0001).
Fig. 4.
Fig. 4.
RNA-seq analysis of allogeneic resorbing colonies. (A) Schematic of RNA-seq experiments. Allogeneic, but compatible, defined lines were fused in colony allorecognition assays and then harvested for RNA-sequencing. Biologic replicates were obtained from stage R = II (resorption score = II) 1° (primary) and 2° (secondary) buds, corresponding to developmental stage D. (B) A hierarchical clustering matrix was generated using Pearson correlation coefficients from log2 counts per million across all genes. Widely divergent transcriptomes were observed across resorption status and developmental stage. The color scale indicates the degree of correlation (white, low correlation; purple, high correlation). (C) Pie chart showing blastogenic stage at time of chimeric resorption.
Fig. 5.
Fig. 5.
Identification of licensing pathways from RNA-seq datasets. (A) Adult zooids were isolated during the takeover phase for RNA-sequencing and compared with R = II allogeneic resorbing tissues to identify shared pathways. Venn diagram plots for differentially expressed genes between nonresorbing 1° and 2° buds, zooids, and resorbing 1° and 2° buds. 1°, primary bud; 2°, secondary bud; R = II (resorption score = II). (B) Genes that were found to be differentially expressed in allogeneic resorbing tissues were intersected with significant GO terms (immune system process and cell adhesion) and displayed in a heat map. Each gene is represented by a single row in the heat map; the color scale ranges from −5 to 5 cpm (blue, low; red, high). Allogeneic and takeover tissues share expression profiles for a number of genes implicated in immunity (highlighted). (C) Hierarchical clustering matrix for differentially expressed genes among allogeneic resorbing tissue samples indicates clustering with stage D takeover pathways. The color scale indicates the degree of correlation (white, low correlation; purple, high correlation). (D) Bot IL17 significantly enhances cytolytic activity in allogeneic in vitro assays compared with untreated and human Fc control (ANOVA). (Left) Bot IL17, 1 µg/mL. (Right) Bot IL17 demonstrates a dose-dependent enhancement of lytic activity in allogeneic cytotoxicity assays. Assays were performed in 96-well plates overnight using differentially labeled cells from allogeneic colonies in 1:10 effector:target ratios, and analyzed by FACS. Error bars = SD. SDS/page analysis of purified recombinant IL17 (Far Right).
Fig. S4.
Fig. S4.
B. schlosseri cell populations analyzed by FACS. (A) B. schlosseri cell suspensions analyzed and sorted using FACS according to their intrinsic size (FSC) and granularity (SSC) properties on log scale. The gate separates cells from debris. (B) Gating on live cells using PI-negative gates. The fluorescent gates are in two dimensions due to B. schlosseri cells strong autofluorescence in every channel; the positive cells above the diagonal represent nonspecific fluorescence. (C) After excluding debris and dead cells, we used again SSC and FSC to characterize five main populations. Using this approach, we can identify five populations of cells, as follows: 1, small lymphocyte-like cells; 2, pigment cells; 3, large phagocytes, nephrocytes, and compartment cells; 4, dark vacuolated morula cells (MCs) and amoebocytes; 5, clear MCs. In captions are representative images of sorted populations based on the gating scheme. (Blue scale bars: 20 µm.) (C is enlarged Fig. 2A).
Fig. S5.
Fig. S5.
GO-category hierarchical clustering of differentially expressed genes across samples. GO category analysis of B. schlosseri microdissected tissue samples. Hierarchical clustering (using city block distance) of GO scores for categories that are statistically significant are displayed in a heat map. Each column represents the result for one comparison, with test group and direction of expression given as a column name. The values of entries are the multiplicative enrichment (reds) and depletion (blues) of genes falling within the given GO category. This analysis reveals two large clusters differentiated by GO term signatures: The left cluster (orange bar) has genes that are higher in buds than zooids and higher in the nonresorbing tissues; the right cluster (purple bar) has genes that are higher in zooids and resorbing tissues, mirroring development stage and resorption status. 1°, primary bud; 2°, secondary bud; Zd, Zooid stage D; R = 0, resorption score = 0; R = II, resorption score = II; (−), down-regulated; (+), up-regulated.
Fig. S6.
Fig. S6.
Profiling allogeneic resorption with RNA-seq. (A) Heat map and cluster analysis demonstrate clear differences among transcriptomes observed across developmental stage and resorption status. (B) Frequency distribution of expression values from RNA-seq bulk samples shown as a violin plot. Expression (vertical axis) is the log2-transformed fold change over median gene expression level across samples. The width of the violin indicates frequency at that expression level. The Top violin plot shows differentially expressed genes in nonresorbing tissues whereas the Bottom violin plot shows differentially expressed genes in resorbing tissues. (C) Venn diagrams among differentially expressed genes between samples. Takeover and allogeneic resorbing tissues share significant overlap in gene expression profiles.
Fig. S7.
Fig. S7.
Morphologic analysis of sites of ampullar injection. (A and B) Dissecting scope images of sites of ampullar injection of MCs (A) and non-MC populations (B) 8 h after cellular transplantation. Areas of necrosis and melanin-like pigmentation develop at sites of MC administration, but not in non-MC recipients (dotted lines mark direction of ampullar injection).

References

    1. Scofield VL, Schlumpberger JM, Weissman IL. Colony specificity in the colonial tunicate Botryllus and the origins of vertebrate immunity. Am Zool. 1982;22(4):783–794.
    1. Voskoboynik A, et al. Identification of a colonial chordate histocompatibility gene. Science. 2013;341(6144):384–387. - PMC - PubMed
    1. Hirose E, Saito Y, Watanabe H. A new type of the manifestation of colony specificity in the compound ascidian, Botrylloides violaceus Oka. Biol Bull. 1988;175(2):240–245.
    1. Rinkevich B, Weissman IL. Allogeneic resorption in colonial protochordates: Consequences of nonself recognition. Dev Comp Immunol. 1992;16(4):275–286. - PubMed
    1. Rinkevich B, Weissman IL. A long-term study on fused subclones in the ascidian Botryllus schlosseri: The resorption phenomenon (Protochordata: Tunicata) J Zool (Lond) 1987;213(4):717–733.

Publication types

LinkOut - more resources