. 2016 Jul 1;197(1):179-87.
doi: 10.4049/jimmunol.1600146. Epub 2016 May 23.

CSF-1R-Dependent Lethal Hepatotoxicity When Agonistic CD40 Antibody Is Given before but Not after Chemotherapy

Affiliations

CSF-1R-Dependent Lethal Hepatotoxicity When Agonistic CD40 Antibody Is Given before but Not after Chemotherapy

Katelyn T Byrne et al. J Immunol. .

Abstract

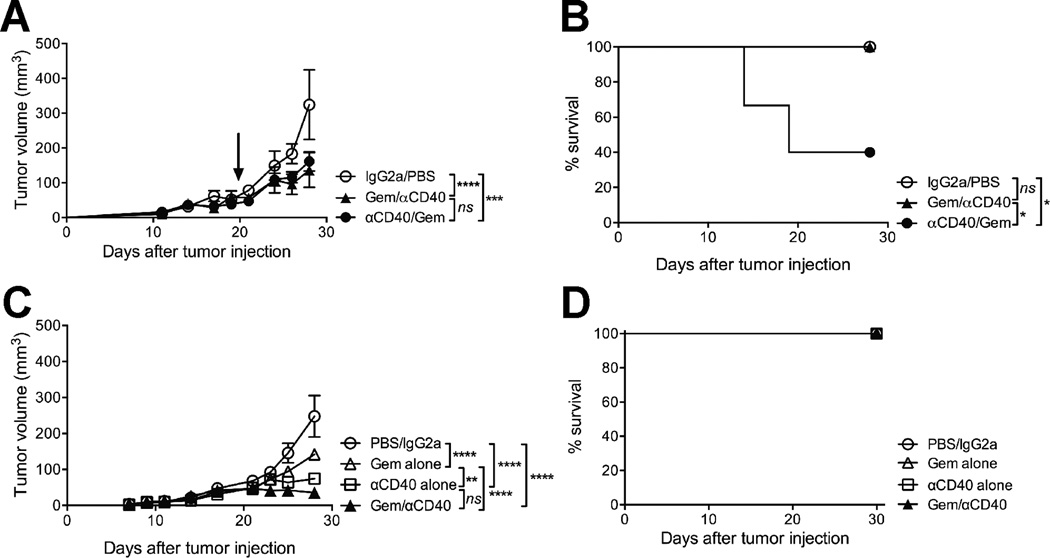
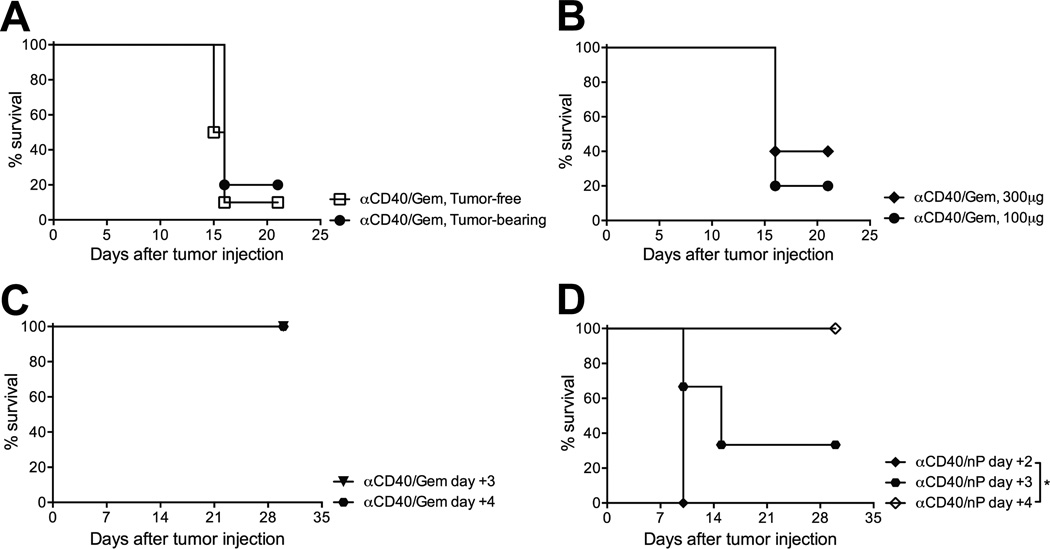
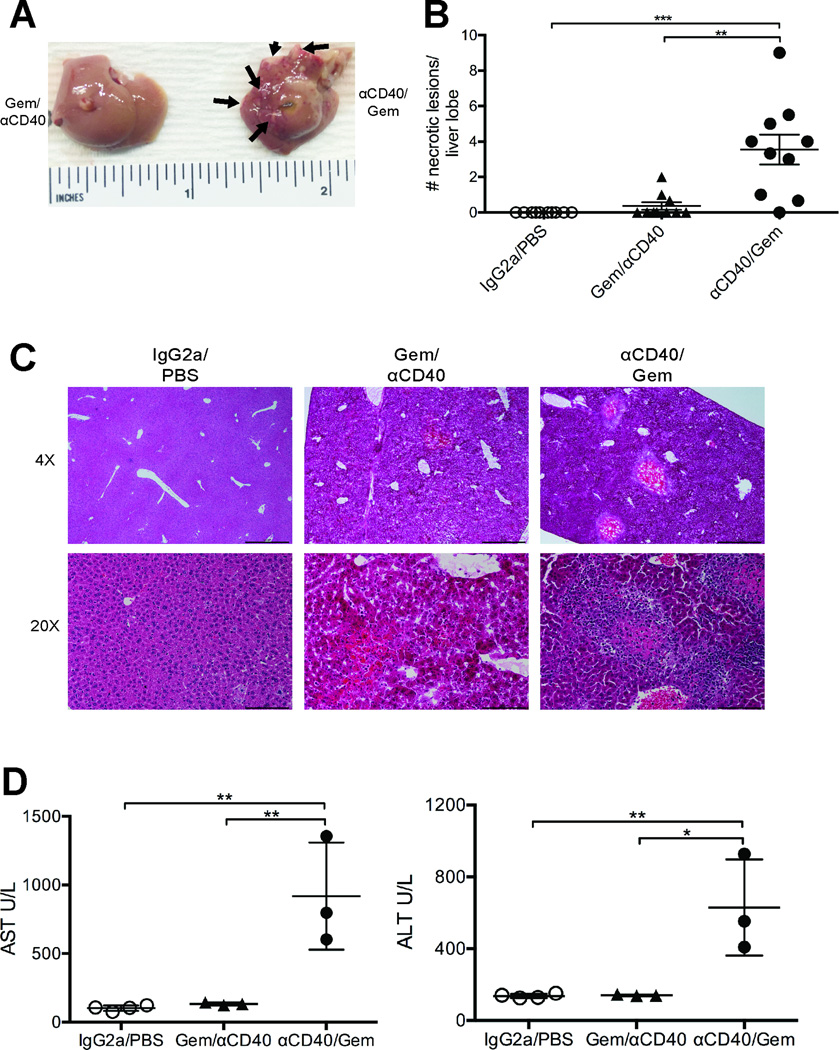
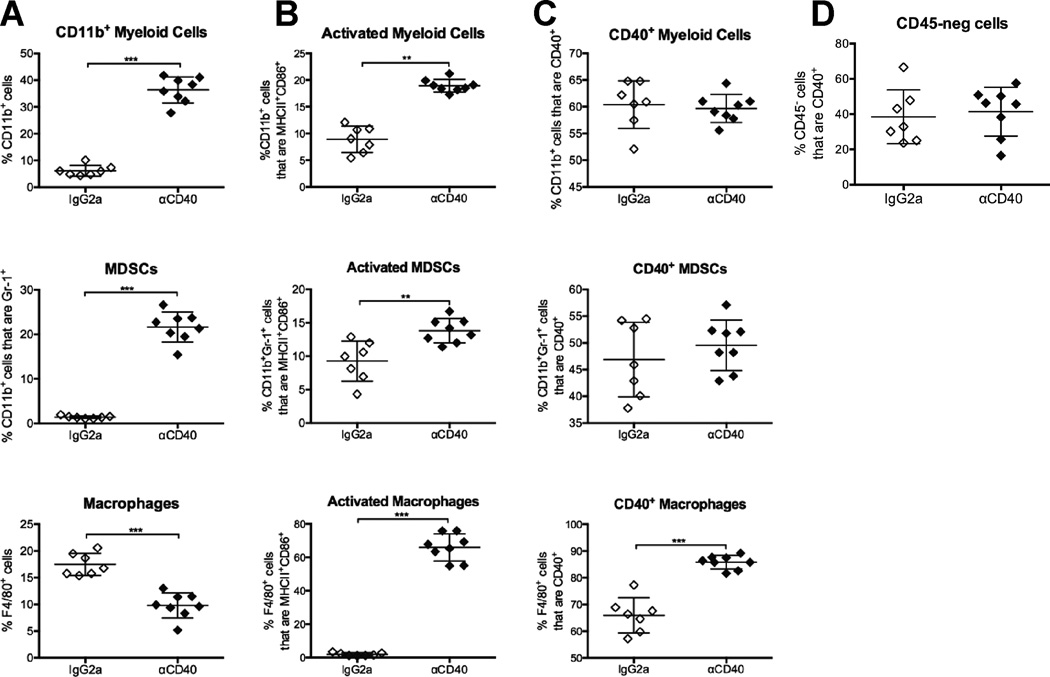
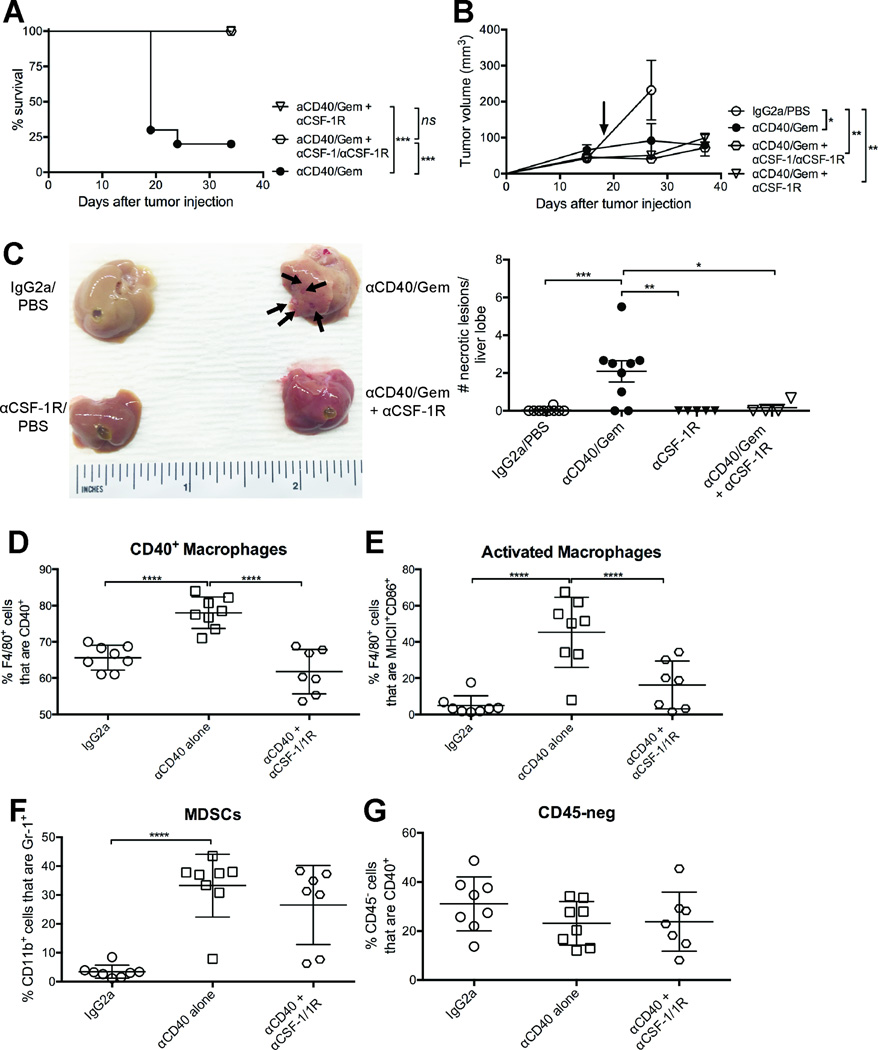
Cancer immunotherapies are increasingly effective in the clinic, especially immune checkpoint blockade delivered to patients who have T cell-infiltrated tumors. Agonistic CD40 mAb promotes stromal degradation and, in combination with chemotherapy, drives T cell infiltration and de novo responses against tumors, rendering resistant tumors susceptible to current immunotherapies. Partnering anti-CD40 with different treatments is an attractive approach for the next phase of cancer immunotherapies, with a number of clinical trials using anti-CD40 combinations ongoing, but the optimal therapeutic regimens with anti-CD40 are not well understood. Pancreatic ductal adenocarcinoma (PDA) is classically resistant to immunotherapy and lacks baseline T cell infiltration. In this study, we used a tumor cell line derived from a genetically engineered mouse model of PDA to investigate alterations in the sequence of anti-CD40 and chemotherapy as an approach to enhance pharmacological delivery of chemotherapy. Unexpectedly, despite our previous studies showing anti-CD40 treatment after chemotherapy is safe in both mice and patients with PDA, we report in this article that anti-CD40 administration <3 d in advance of chemotherapy is lethal in more than half of treated C57BL/6 mice. Anti-CD40 treatment 2 or 3 d before chemotherapy resulted in significantly increased populations of both activated myeloid cells and macrophages and lethal hepatotoxicity. Liver damage was fully abrogated when macrophage activation was blocked using anti-CSF-1R mAb. These studies highlight the dual nature of CD40 in activating both macrophages and T cell responses, and the need for preclinical investigation of optimal anti-CD40 treatment regimens for safe design of clinical trials.


Figures

Figure 1
Figure 1. Agonistic CD40 antibody is lethal when administered before chemotherapy
Mice were injected with 4662 PDA tumor cell line, and received either Gem on day 12 and αCD40 on day 14 (Gem/αCD40), or αCD40 on day 12 and Gem on day 14 (αCD40/Gem), or vehicle controls (IgG2a on day 12, PBS on day 14). (A) Tumor growth curves of mice treated as indicated, representative of two independent experiments, n=5–10 mice/group. Arrow indicates time point at which 4/10 mice died in αCD40/Gem treatment group, following this time point only tumor growth on the surviving 6/10 mice is shown. (B) Survival curve of mice treated as indicated, from two combined experiments, n=5–10 mice/group. (C) Tumor growth curves of mice treated as indicated including Gem alone or αCD40 alone on day 12, representative of 2 independent experiments, n=6 mice per group. (D) Survival curve of mice from (C). Statistical analysis by two-way ANOVA with Tukey’s HSD post-test (A, C) or by Kaplan-Meier (B, D). Each symbol represents a group of mice, error bars indicate SEM, ns indicates not significant, * indicates P < 0.05, *** P < 0.001, **** P < 0.0001.
Figure 2
Figure 2. Chemotherapy is toxic when administered two days after αCD40 therapy, regardless of tumor-bearing status of the host
(A) Mice were injected with 4662 PDA tumor cells (tumor-bearing) or left uninjected (tumor-free) on day 0, and received αCD40 on day 11 and Gem on day 13. Survival curve representative of 4 experiments, 5–10 mice/group. (B) Mice were treated as described in Fig. 1, except that tumor-bearing mice received either 100 or 300 µg of αCD40 on day 11 as indicated, followed by Gem on day 13. Survival representative of 2 experiments, n=5 mice/group. (C) Mice were treated as described in Fig. 1, except that Gem was administered 3 days or 4 days after αCD40, as indicated. Survival curve representative of 2 experiments, n=3–5 mice/group. (D) Mice were treated as described in Fig. 1, except that mice received nab-paclitaxel (nP) instead of Gem on 2, 3, or 4 days, as indicated, after αCD40 treatment, n=3 mice/group. Each symbol represents a group of mice, statistical analyses by Kaplan-Meier (* indicates P < 0.05).
Figure 3
Figure 3. αCD40 followed by chemotherapy causes hepatotoxicity
Mice were treated as described in Fig. 1, and mice were euthanized 48 hours after the end of treatment (day 16). (A) Representative livers from indicated treatment groups with macroscopic lesions indicated by arrows. (B) Quantification of lesions observed at 4X per lobe of liver for indicated groups, from two combined experiments with n=4–5 mice/group. (C) Representative liver H&E sections shown from indicated treatment group. (D) Mice were treated as described in Fig. 1, and mice were euthanized 12 hours after the end of treatment (day 14.5). Serum was collected from whole blood, and analyzed for AST and ALT as indicated. Each symbol represents a single mouse, error bars indicated SEM (B) and SD (D). Statistical analysis by one-way ANOVA with Tukey’s HSD post-test, * indicates P < 0.05, ** P < 0.01, *** P < 0.001, **** P < 0.0001.
Figure 4
Figure 4. αCD40 therapy increases the frequency of activated macrophages in the livers of treated mice
Mice were treated with αCD40 and sacrificed one day after treatment. Livers were harvested and analyzed by flow cytometry with regard to the indicated cell populations among live, CD45+ cells (A–C) or live, CD45-neg cells (D). Each symbol represents an individual mouse, horizontal bars indicated mean, and error bars indicate SD, data representative of two independent experiments with n=5–8mice/group. Statistical analysis by Mann-Whitney unpaired T test, * indicates P < 0.05, ** P < 0.01 and *** P < 0.001.
Figure 5
Figure 5. Blockade of macrophage activation abrogates hepatotoxicity of αCD40/Gem treatment
Mice were treated as described in Figure 1, except some mice also received αCSF-1 and/or αCSF-1R starting on day 6 and repeated every three days for the duration of the experiment. (A–B) Survival curve (A) or tumor growth kinetics (B) of mice treated with αCD40/Gem or αCD40/Gem with αCSF-1 and/or αCSF-1R. Data representative of three independent experiments with n=4–10 mice/group, and from two combined experiments (right). Each symbol represents a group of mice, error bars indicate mean ± SEM, and arrow indicates time point when 7/19 mice died in αCD40/Gem treated group. (C) Mice were treated as in (A), except that mice were sacrificed on day 16. (Left) Representative livers from indicated treatment groups with macroscopic lesions indicated by arrows. (Right) Quantification of lesions observed at 4X per lobe of liver for indicated groups, from two combined experiments with n=4–5 mice/group. (D–G) Mice were euthanized on day 12, and livers were analyzed by flow cytometry with regard to the indicated cell populations among live, CD45+ cells (D–F) or live, CD45-neg cells (G). Each symbol represents a single mouse, n=7–8mice/group, data representative of two independent experiments, horizontal line indicates mean ± SD. Statistical analyses by Kaplan-Meier (A,), two-way ANOVA (B), or one-way ANOVA with Tukey’s HSD post-test (C–G), * indicates P < 0.05, ** P < 0.01, *** P < 0.001, and **** P < 0.0001.

References

    1. Brahmer JR, Tykodi SS, Chow LQ, Hwu WJ, Topalian SL, Hwu P, Drake CG, Camacho LH, Kauh J, Odunsi K, Pitot HC, Hamid O, Bhatia S, Martins R, Eaton K, Chen S, Salay TM, Alaparthy S, Grosso JF, Korman AJ, Parker SM, Agrawal S, Goldberg SM, Pardoll DM, Gupta A, Wigginton JM. Safety and activity of anti-PD-L1 antibody in patients with advanced cancer. N. Engl. J. Med. 2012;366:2455–2465. - PMC - PubMed
    1. Hodi FS, O'Day SJ, McDermott DF, Weber RW, Sosman JA, Haanen JB, Gonzalez R, Robert C, Schadendorf D, Hassel JC, Akerley W, van den Eertwegh AJ, Lutzky J, Lorigan P, Vaubel JM, Linette GP, Hogg D, Ottensmeier CH, Lebbe C, Peschel C, Quirt I, Clark JI, Wolchok JD, Weber JS, Tian J, Yellin MJ, Nichol GM, Hoos A, Urba WJ. Improved survival with ipilimumab in patients with metastatic melanoma. N. Engl. J. Med. 2010;363:711–723. - PMC - PubMed
    1. Robert C, Schachter J, Long GV, Arance A, Grob JJ, Mortier L, Daud A, Carlino MS, McNeil C, Lotem M, Larkin J, Lorigan P, Neyns B, Blank CU, Hamid O, Mateus C, Shapira-Frommer R, Kosh M, Zhou H, Ibrahim N, Ebbinghaus S, Ribas A, investigators K- Pembrolizumab versus Ipilimumab in Advanced Melanoma. N. Engl. J. Med. 2015;372:2521–2532. - PubMed
    1. Sharma P, Allison JP. Immune checkpoint targeting in cancer therapy: toward combination strategies with curative potential. Cell. 2015;161:205–214. - PMC - PubMed
    1. Tumeh PC, Harview CL, Yearley JH, Shintaku IP, Taylor EJ, Robert L, Chmielowski B, Spasic M, Henry G, Ciobanu V, West AN, Carmona M, Kivork C, Seja E, Cherry G, Gutierrez AJ, Grogan TR, Mateus C, Tomasic G, Glaspy JA, Emerson RO, Robins H, Pierce RH, Elashoff DA, Robert C, Ribas A. PD-1 blockade induces responses by inhibiting adaptive immune resistance. Nature. 2014;515:568–571. - PMC - PubMed

Publication types

MeSH terms

Substances