. 2016;25(1):301-320.
doi: 10.1080/10618600.2014.1002927. Epub 2016 Mar 9.

Computational Aspects of Optional Pólya Tree

Affiliations

Computational Aspects of Optional Pólya Tree

Hui Jiang et al. J Comput Graph Stat. 2016.

Abstract

Optional Pólya tree (OPT) is a flexible nonparametric Bayesian prior for density estimation. Despite its merits, the computation for OPT inference is challenging. In this paper we present time complexity analysis for OPT inference and propose two algorithmic improvements. The first improvement, named limited-lookahead optional Pólya tree (LL-OPT), aims at accelerating the computation for OPT inference. The second improvement modifies the output of OPT or LL-OPT and produces a continuous piecewise linear density estimate. We demonstrate the performance of these two improvements using simulated and real date examples.

Keywords: Bayesian nonparametrics; density estimation; recursive partition; smoothing; time complexity.


Figures

Figure 1
Figure 1
The running time for exact OPT inference using the cached implementation (See Section 4). Running times (in seconds) are plotted against different dimensions with sample size fixed at 1, 000 (left figure) as well as different sample sizes with number of dimensions fixed at 4 (right figure). The samples are distributed as bivariate normal in the first two dimensions and uniform in other dimensions. This setting helps concentrate the partitions in the first two dimensions and allow manual visual checking of the partitions (e.g., as in Figure 6).
Figure 2
Figure 2
Examples of undesired situations for a triangulation.
Figure 3
Figure 3
A OPT partition in 2-D (left) and its triangulation (right).
Figure 4
Figure 4
A continuous piecewise linear basis function.
Figure 5
Figure 5
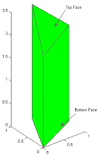
The bottom face (the simplex Δj) and top face in a density plot.
Figure 6
Figure 6
The partition plots based on the exact OPT and the LL-OPT algorithms with h = 1, …, 5 for Example 6.1. The samples are drawn from a mixture of uniform and “semi-beta” distributions as defined by (6.1). The sample size is 1, 000.
Figure 7
Figure 7
Plot of densities estimated with 104 samples simulated from (6.3) by OPT and LL-OPT in red (they are complete overlapped), and FEE in black. The true density is in blue.
Figure 8
Figure 8
The estimated densities for Example 6.4. (a) Densities estimated by LL-OPT (left) and FEE (right) with 103 and 104 samples simulated from (6.4) respectively. (b) Density estimated by kernel density estimation with 104 samples.
Figure 9
Figure 9
The marginal histograms of 104 random samples drawn from the fitted FEE density and the true density for Example 6.5. From top to bottom are the histograms of Y1 to Y5.

Similar articles

Cited by

References

    1. Allaire G. Numerical Analysis and Optimization. Oxford Science Publications; 2007.
    1. Bache K, Lichman M. Uci machine learning repository. 2013;19 URL http://archive.ics.uci.edu/ml.
    1. Barron AR, Gyorfi L, van der Meulen EC. Distribution estimation consistent in total variation and in two types of information divergence. IEEE Trans Inf Theor. 1992;38(5):1437–1454.
    1. Denison DG, Mallick BK, Smith AF. A bayesian cart algorithm. Biometrika. 1998;85(2):363–377.
    1. Escobar MD, West M. Bayesian density estimation and inference using mixtures. Journal of the american statistical association. 1995;90(430):577–588.