. 2016 Apr 28;6(7):1043-52.
doi: 10.7150/thno.14566. eCollection 2016.

Indocyanine Green-Loaded Polydopamine-Reduced Graphene Oxide Nanocomposites with Amplifying Photoacoustic and Photothermal Effects for Cancer Theranostics

Affiliations

Indocyanine Green-Loaded Polydopamine-Reduced Graphene Oxide Nanocomposites with Amplifying Photoacoustic and Photothermal Effects for Cancer Theranostics

Dehong Hu et al. Theranostics. .

Abstract

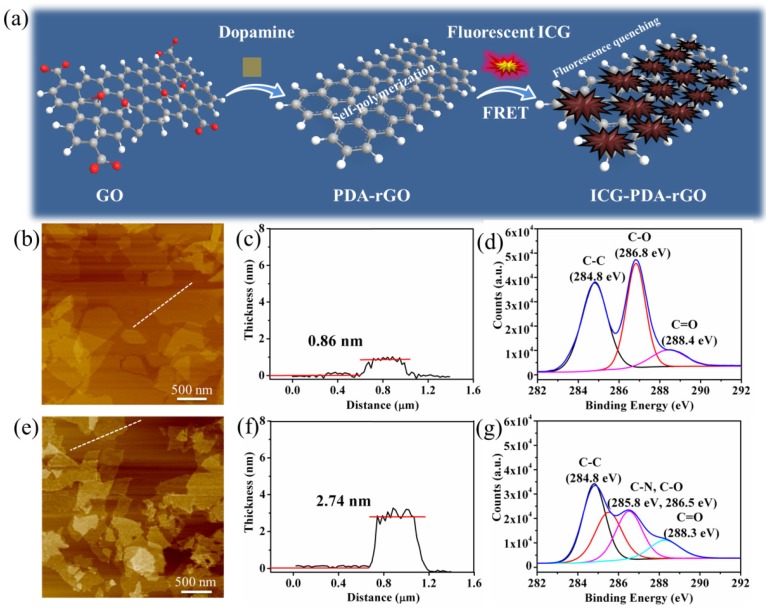
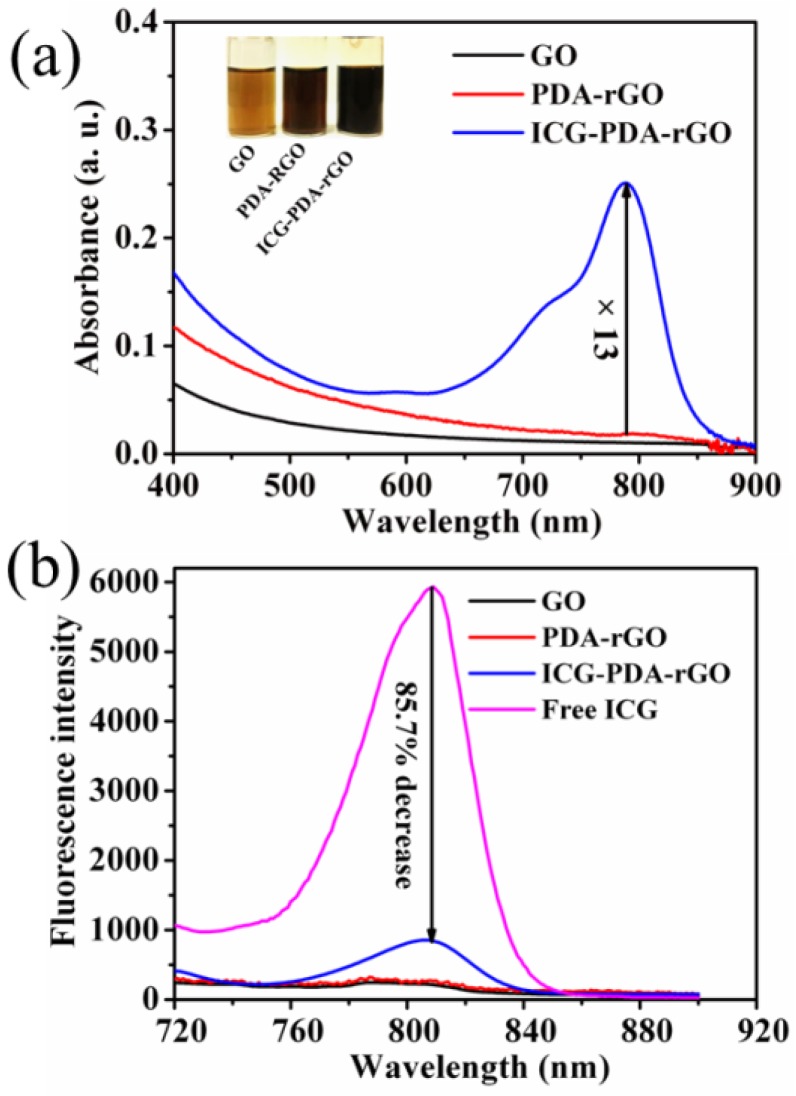
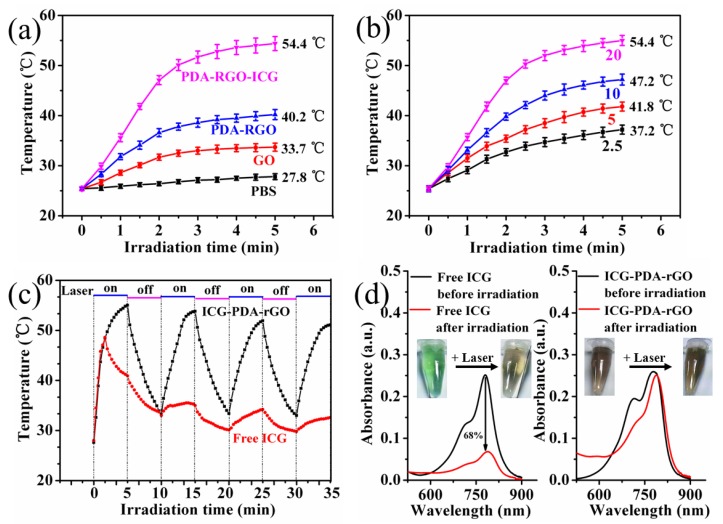
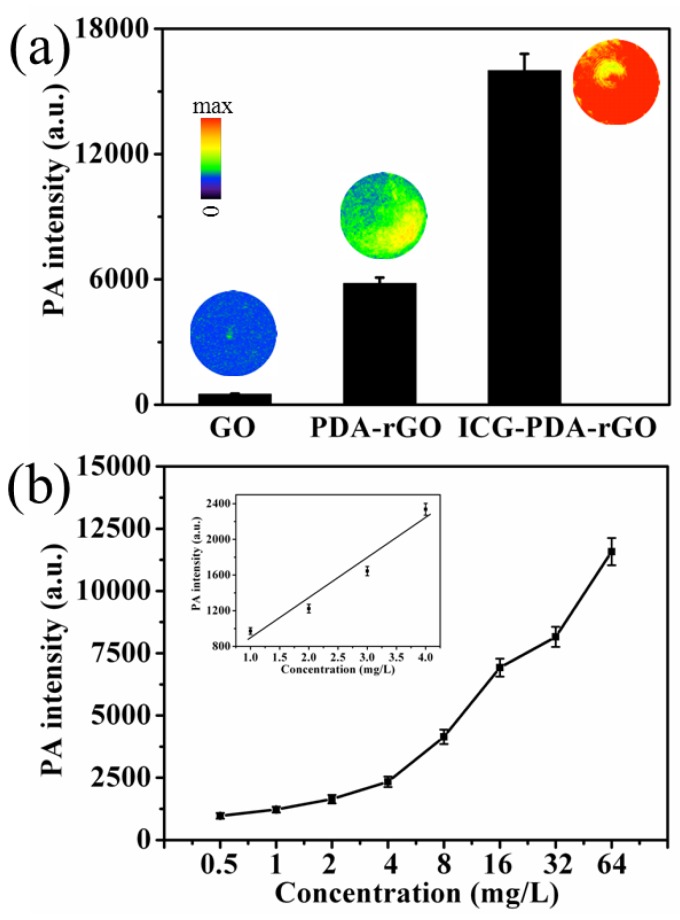
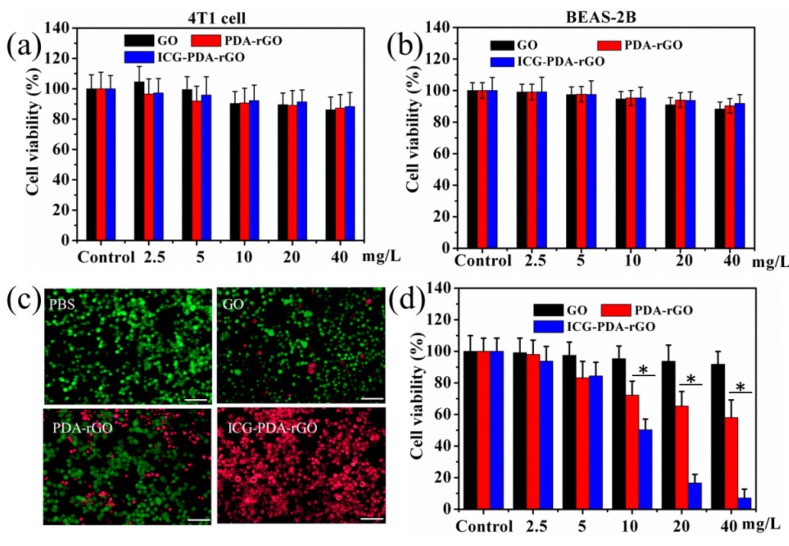
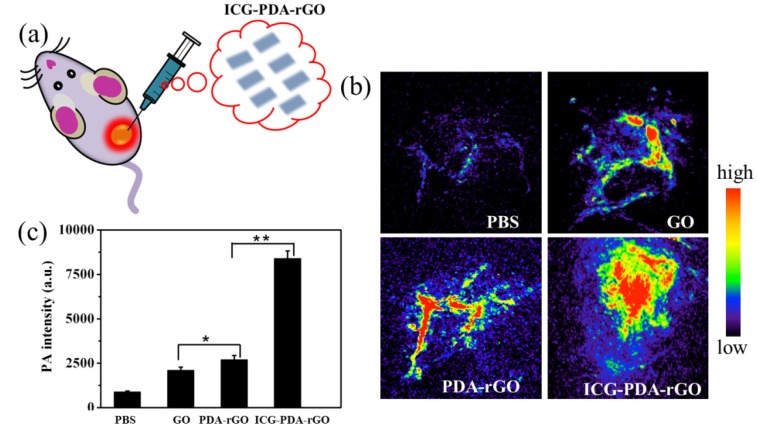
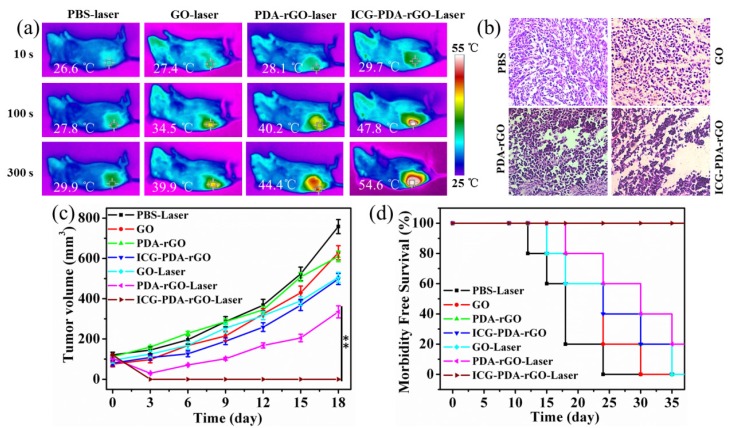
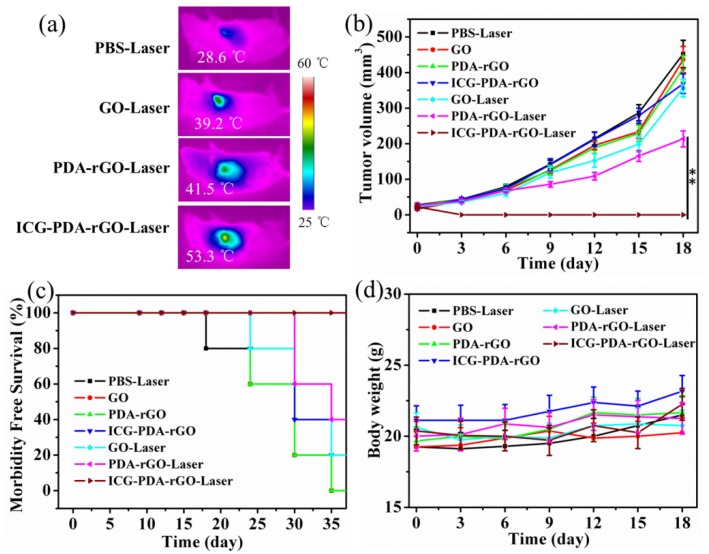
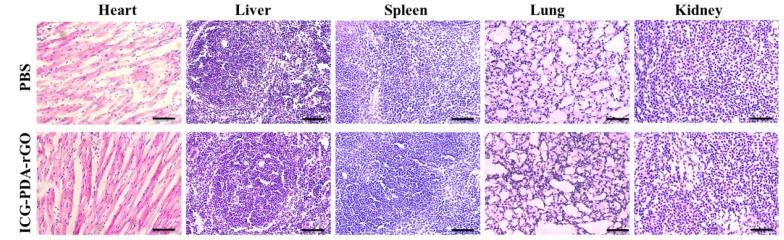
Photoacoustic (PA) imaging and photothermal therapy (PTT) as light-induced theranostic platforms have been attracted much attention in recent years. However, the development of highly efficient and integrated phototheranostic nanoagents for amplifying PA imaging and PTT treatments poses great challenges. Here, we report a novel phototheranostic nanoagent using indocyanine green-loaded polydopamine-reduced graphene oxide nanocomposites (ICG-PDA-rGO) with amplifying PA and PTT effects for cancer theranostics. The results demonstrate that the PDA layer coating on the surface of rGO could effectively absorb a large number of ICG molecules, quench ICG's fluorescence, and enhance the PDA-rGO's optical absorption at 780 nm. The obtained ICG-PDA-rGO exhibits stronger PTT effect and higher PA contrast than that of pure GO and PDA-rGO. After PA imaging-guided PTT treatments, the tumors in 4T1 breast subcutaneous and orthotopic mice models are suppressed completely and no treatment-induced toxicity being observed. It illustrates that the ICG-PDA-rGO nanocomposites constitute a new class of theranostic nanomedicine for amplifying PA imaging and PTT treatments.

Keywords: Indocyanine green; Photoacoustic imaging; Photothermal therapy.; Reduced graphene oxide; Theranostics.


Conflict of interest statement

Competing Interests: The authors have declared that no competing interest exists.

Figures

Figure 1
Figure 1
Synthesis and characterization of ICG-PDA-rGO. (a) Schematic illustration of the prepared process of ICG-PDA-rGO. AFM images of GO (b) and ICG-PDA-rGO (e). The AFM height analysis of GO (c) and ICG-PDA-rGO (f). The C1s XPS analysis of GO (d) and ICG-PDA-rGO (g).
Figure 2
Figure 2
The optical properties of ICG-PDA-rGO. (a) UV-vis absorption spectra of GO, PDA-rGO and ICG-PDA-rGO. The inset shows photographs of GO, PDA-rGO and ICG-PDA-rGO aqueous solutions. (b) Fluorescence spectra of GO, PDA-rGO, ICG-PDA-rGO and free ICG. The arrow indicates that the fluorescence of free ICG decreased by 85.7% after loading on the surface of PDA-rGO.
Figure 3
Figure 3
The photothermal effect of ICG-PDA-rGO. (a) Photothermal heating curves of PBS, GO, PDA-rGO and ICG-PDA-rGO solutions. CGO=CPDA-rGO=CICG-PDA-rGO=20 mg/L. (b) Photothermal heating curves of ICG-PDA-rGO with different concentrations. From down to up: 2.5, 5, 10, 20 mg/L. (c) Temperature evaluation of ICG-PDA-rGO and equal free ICG solutions over four laser ON/OFF cycles. (laser ON time: 5 min, laser OFF time: 5 min). (d) The UV-vis absorption spectra of free ICG and ICG-PDA-rGO solutions before and after four cycles of laser irradiation. The insets show the photographs of free ICG and ICG-PDA-rGO solutions before and after four cycles of irradiation. The laser power was 808 nm@0.6W/cm2.
Figure 4
Figure 4
The optical PA imaging of ICG-PDA-rGO solution. (a) PA signal intensity and PA images of GO, PDA-rGO and ICG-PDA-rGO aqueous solutions. CGO=CPDA-rGO=CICG-PDA-rGO=10 mg/L. (b) The relationship between PA signal intensity and the concentration of ICG-PDA-rGO. Insert shows the linear relationship between PA signal intensity and the concentration of ICG-PDA-rGO.
Figure 5
Figure 5
Cytotoxicity and in vitro PTT. Relative viability of 4T1 cells (a) and BEAS-2B cells (b) incubated with various concentrations of GO, PDA-rGO and ICG-PDA-rGO for 48h. (c) Fluorescence images of Calcein AM/PI stained 4T1 cells incubated with PBS, GO, PDA-rGO and ICG-PDA-rGO. Scale bars are 50 μm. (d) Quantitative detection of 4T1 cells viability following PTT with ICG-PDT-rGO for 5 min. Laser irradiation dose: 808 nm, 0.6W/cm2, 5 min. (*)p<0.05.
Figure 6
Figure 6
In vivo PA imaging of ICG-PDA-rGO. (a) Schematic illustration of i.t. injected of ICG-PDA-rGO. (b) In vivo PA imaging of tumor treated with PBS, GO, PDA-rGO and ICG-PDA-rGO. (C) Statistics of mean PA intensity of the samples measured from in vivo PA imaging. Error bars were taken from three parallel experiments. (*)p<0.05, (**)p<0.01.
Figure 7
Figure 7
In vivo cancer PTT in xenograft mice model with 4T1 breast cancer. (a) Thermal images of 4T1 tumor-bearing mice exposed to 808 nm laser (0.6W/cm2) after i.t. injection of PBS, GO, PDA-rGO and ICG-PDA-rGO, respectively. (b) H&E-stained images of tumor sections collected from different treated groups after 5 h treatment. (c) Tumor growth curves of different groups of 4T1 tumor-bearing mice. (d) Survival rates of mice bearing 4T1 tumors after various treatments. (**)p<0.01.
Figure 8
Figure 8
In vivo cancer PTT in orthotopic mice model. (a) Thermal images of 4T1 tumor-bearing mice exposed to 808 nm laser (0.6 W/cm2) after intratumor injection of PBS, GO, PDA-rGO and ICG-PDA-rGO, respectively. (b) Tumor growth curves of different groups of 4T1 tumor-bearing mice. (c) Survival rates of mice bearing 4T1 tumors after various treatments. (d) Body weights were measured during 18 day evaluation period in mice with different treatments. (**)p<0.01.
Figure 9
Figure 9
Representative H&E stained images of major organs including the heart, liver, spleen, lung and kidney collected from the PBS injected mice and ICG-PDA-rGO injected mice. The dose of ICG-PDA-rGO was 2 mg/kg. These images were obtained under a light microscope.

Similar articles

Cited by

References

    1. Cheng L, Liu J, Gu X, Gong H, Shi X, Liu T. et al. PEGylated WS(2) nanosheets as a multifunctional theranostic agent for in vivo dual-modal CT/photoacoustic imaging guided photothermal therapy. Adv Mater. 2014;26:1886–93. - PubMed
    1. Liu J, Zheng X, Yan L, Zhou L, Tian G, Yin W. et al. Bismuth sulfide nanorods as a precision nanomedicine for in vivo multimodal imaging-guided photothermal therapy of tumor. ACS Nano. 2015;9:696–707. - PubMed
    1. Liang X, Li Y, Li X, Jing L, Deng Z, Yue X. et al. PEGylated polypyrrole nanoparticles conjugating gadolinium chelates for dual-modal MRI/photoacoustic imaging guided photothermal therapy of cancer. Adv Fun Mater. 2015;25:1451–62.
    1. Wang LV, Hu S. Photoacoustic tomography: in vivo imaging from organelles to organs. Science. 2012;335:1458–62. - PMC - PubMed
    1. Nie L, Huang P, Li W, Yan X, Jin A, Wang Z. et al. Early-stage imaging of nanocarrier-enhanced chemotherapy response in living subjects by scalable photoacoustic microscopy. ACS Nano. 2014;8:12141–50. - PMC - PubMed

Publication types

MeSH terms