. 2015 Dec;2(1):1-10.

The Phase Lag between Agonist-Induced Oscillatory Ca2+ and IP3 Signals Does Not Imply Causality (December 2015)

Affiliations

The Phase Lag between Agonist-Induced Oscillatory Ca2+ and IP3 Signals Does Not Imply Causality (December 2015)

Pei-Chi Yang et al. Calcium Signal (St Clara). 2015 Dec.

Abstract

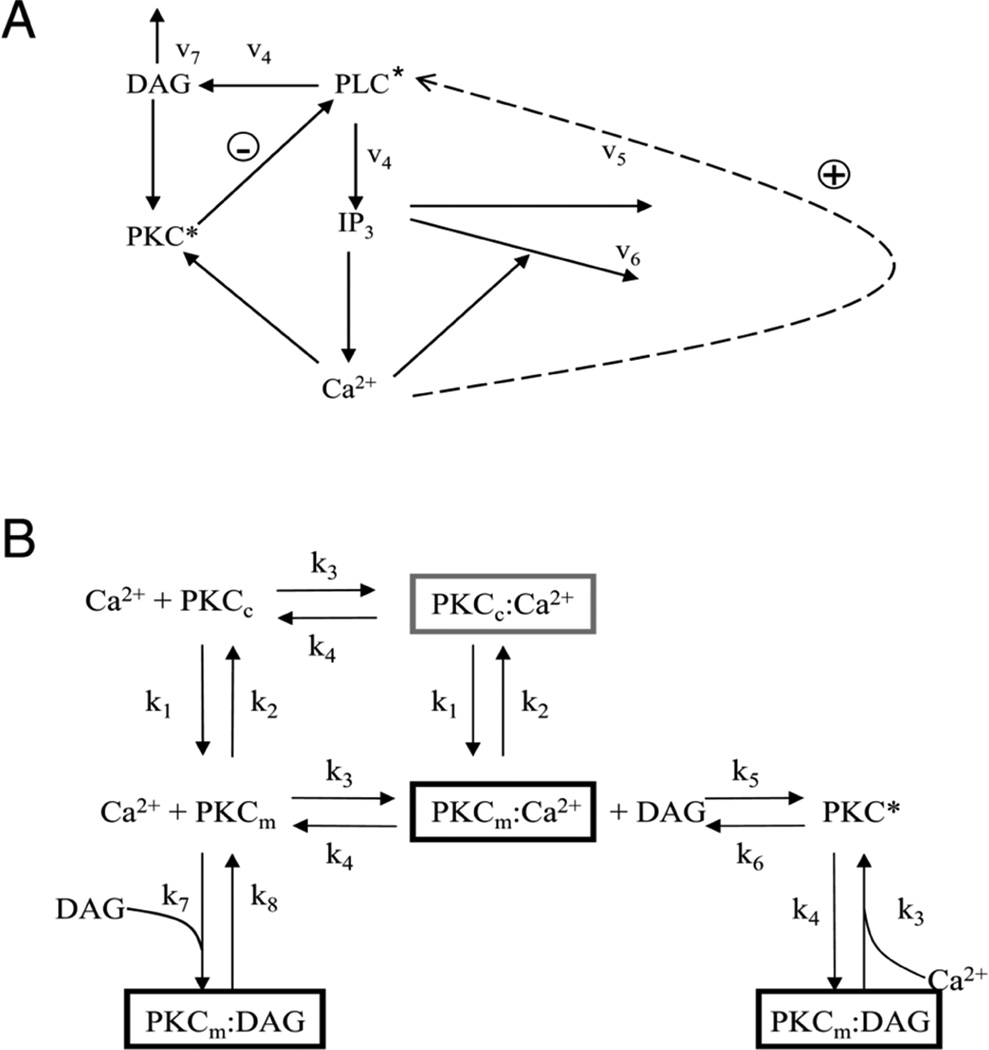
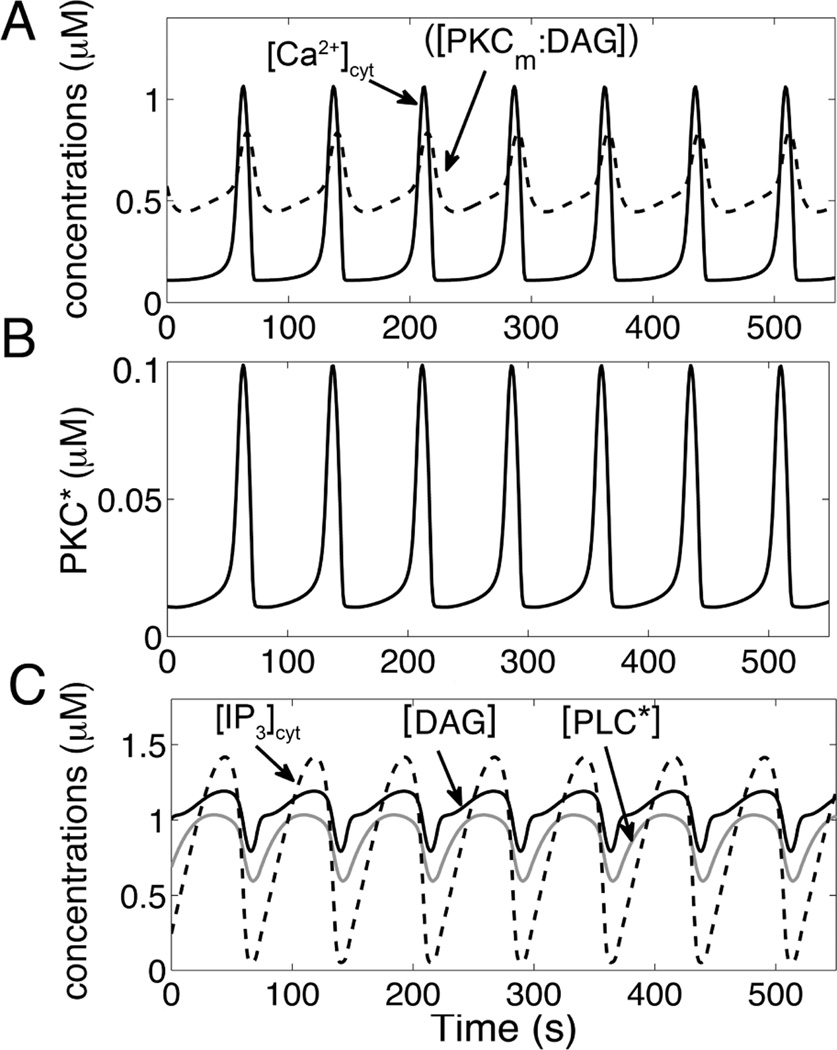
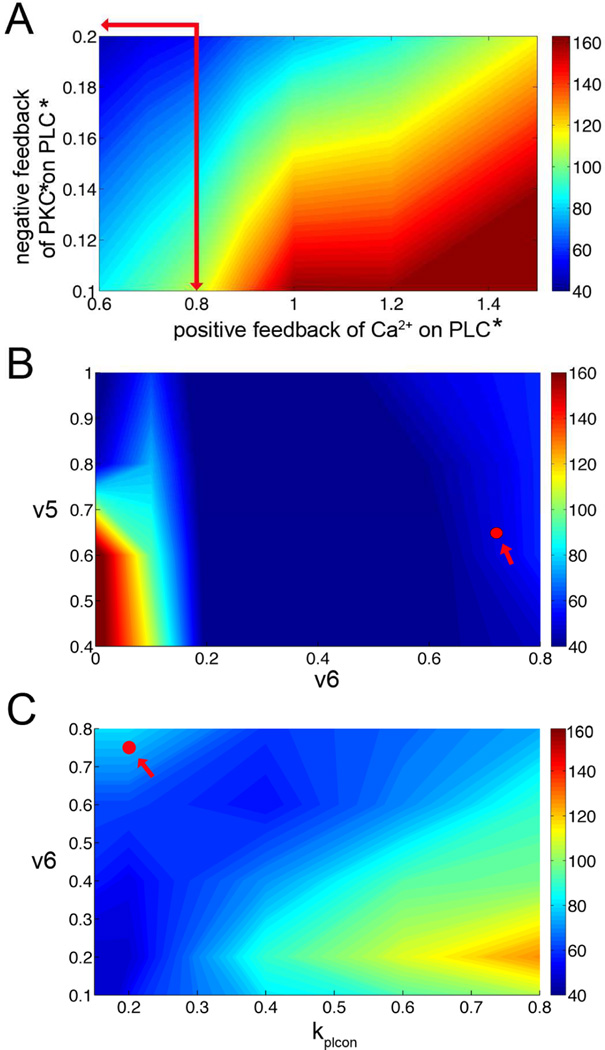
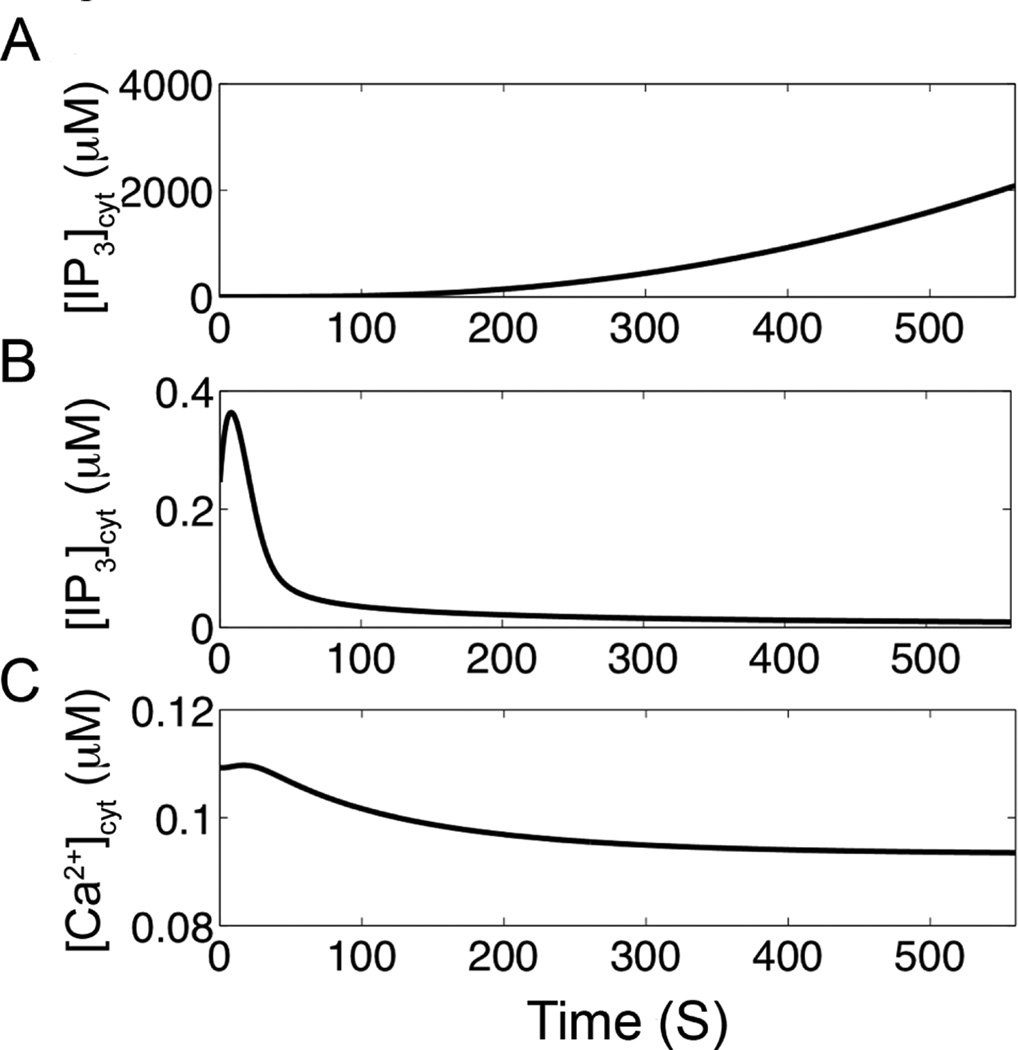
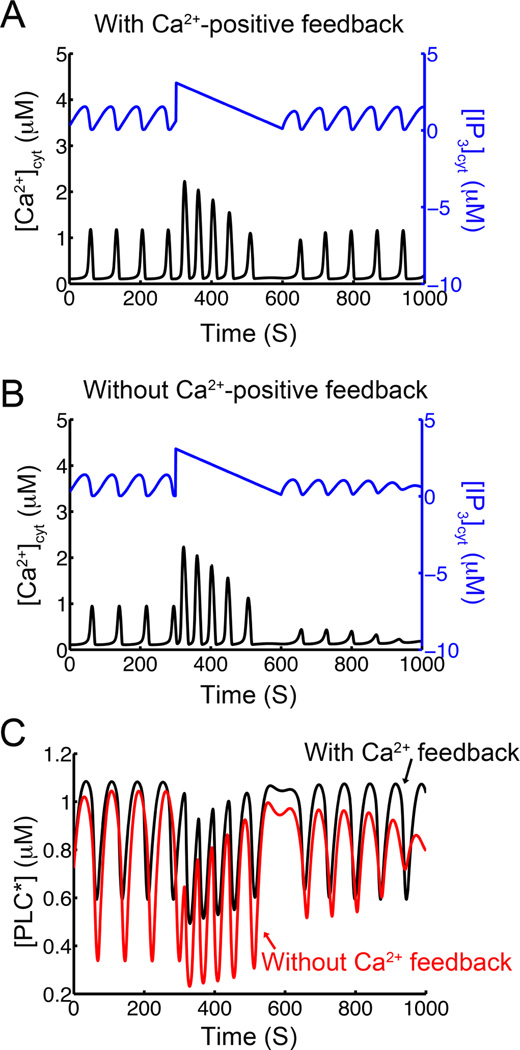
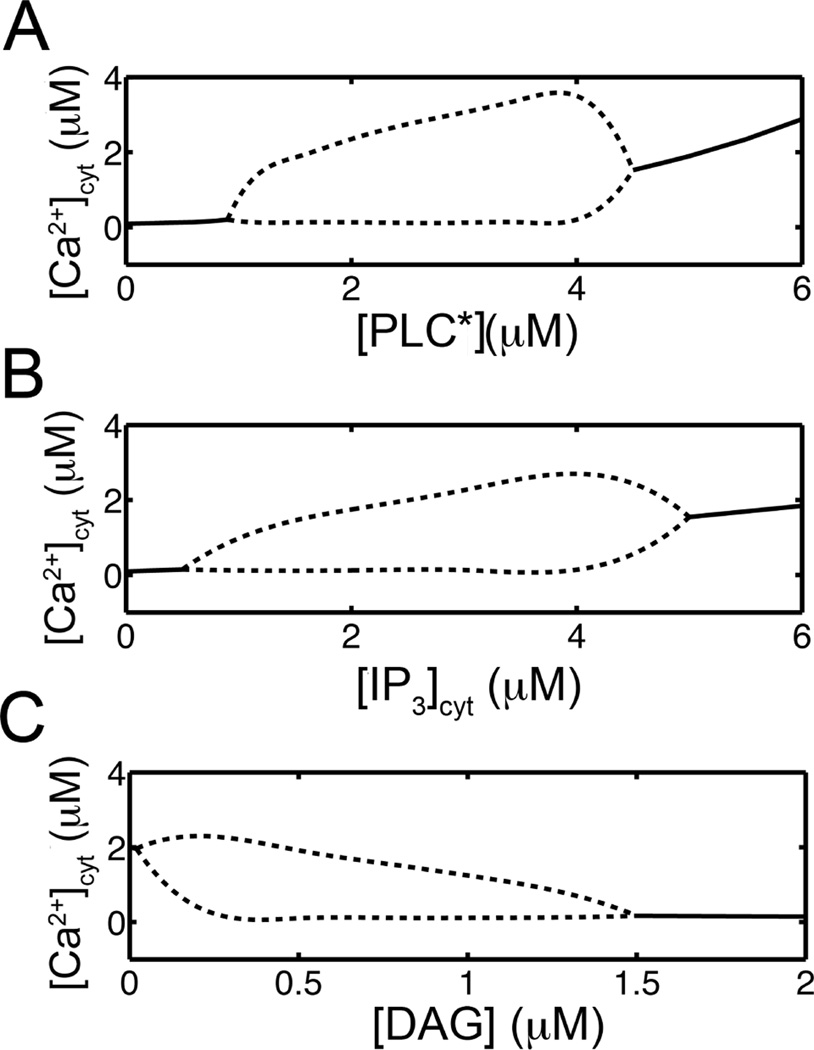
Activated phospholipase C (PLC*) generates 1,4,5-triphosphate (IP3) and diacylglycerol (DAG) from phosphatidyl inositol (PIP2). The DAG remains in the plasma membrane and co-activates conventional protein kinase C (PKC) with Ca2+. We have developed a mathematical model for the activation of the Ca2+-dependent PKC and its negative feedback on phospholipase C (PLC) and coupled it to the De Young-Keizer model for IP3 mediated Ca2+ oscillations. The model describes the cascade of reactions for the translocation of PKC to plasma membrane, and simulates activation of Ca2+ and diacylglycerol (DAG) oscillations. The model demonstrates that oscillations in Ca2+ and DAG are possible with or without a positive Ca2+ feedback on phospholipase C consistent with experiment. In many experimental studies, the timing of the peaks of the Ca2+ and IP3 oscillations have been used to suggest causality, i.e. that the IP3 oscillations cause the Ca2+ oscillations. The model is used to explore this question. To this end, the positive and negative feedback between Ca2+ and IP3 production are modulated, resulting in changes to the phase lag between the peaks in [Ca2+]cyt and [IP]cyt. The model simulates a possible experimental protocol that can be used to differentiate whether or not the positive feedback of Ca2+ on PLC is needed for the oscillations.

Keywords: calcium oscillation; computational model; diacyl glycerol (DAG); phospholipase C (PLC); protein kinase C (PKC).


Figures

Fig. 1
Fig. 1
Model schematic. A. PLC activation pathway. (DAG – diacyl glycerol; PKC* - activated protein kinase C; PLC* – activated phospholipase C; IP3 – inositol 1,4,5-trisphosphate; Ca2+ - calcium ion, v1–v6 – reaction rates). The dashed line indicates the positive feedback of Ca2+ on PLC which is explored further in this study. B. Reaction scheme for PKC activation. (PKCc – cytoplasmic PKC; PKCm – membrane associated PKC; k1–k8 reaction rates).
Fig. 2
Fig. 2
Simulated time courses of concentrations. A. Simulated intracellular Ca2+, DAG binding domains of PKC-C1 (PKCm:DAG) oscillations when PLC is active (top panel). The translocation of C1 is delayed by a few seconds. B. Activated PKC (PKC*) oscillations are almost in-phase with Ca2+ transit. C. Activated PLC ([PLC*]), DAG and IP3 show in-phase oscillations.
Fig. 3
Fig. 3
Simulated time courses of concentrations. A. Free PKC concentrations in the cytosol [PKCc] and PKC concentrations associated with the plasma membrane [PKCm] oscillate during PLC activation pathway. B. PKC bound to Ca2+ in cytoplasm ([PKCc:Ca2+]), and C. Ca2+ binding of PKC-C2 domains translocate to plasma membrane ([PKCm:Ca2+]) both oscillate during Ca2+ oscillations.
Fig. 4
Fig. 4
Phase maps. A. The effects of positive feedback of Ca2+ and negative feedback of PKC* on Ca2+ and DAG oscillations. These plots show the phase difference between the [Ca2+]cyt and [IP3]cyt oscillation peaks. The phase difference is calculate as 360*((time of Ca2+ peak) - (time of DAG peak))/(oscillation period), In this way when the periods are aligned the value is 0, when they are opposite in phase it is 180. The synchronization between Ca2+ and DAG oscillations varies with feedback strength. B. The changing of the degradation rate of IP3 (v5) affects the phase differences of Ca2+ and IP3. When v6 (Ca2+ dependent rate of PLC activation) large, the oscillations of calcium and IP3 are in phase. The default model parameter is shown by the red circle. C. The Ca2+ dependent rate of PLC activation (v6) and Ca2+ dependent rate kplcon for positive feedback affect the phase differences of Ca2+ and IP3. The default model parameter is shown by the red circle.
Fig. 5
Fig. 5
Ca2+ oscillations affect IP3 and activated PLC ([PLC*]) oscillations. A. There is no IP3 oscillation when Ca2+ is set to a constant level (1.0 µM). B. Blocking DAG degradation eliminates [PLC*] oscillation (dashed line), whereas DAG degradation results in PLC oscillations (solid line).
Fig. 6
Fig. 6
Blocking the feedbacks on PLC affect Ca2+ dynamics. A. There are no Ca2+ oscillations and the IP3 rise by blocking PKC. Furthermore, the IP3 concentration rises as there is no negative feedback on PLC. B. When the positive feedback of Ca2+ on PLC is eliminated the IP3 concentration returns to steady state. C. When the positive feedback of Ca2+ on PLC is eliminated the Ca2+ concentration also returns to steady-state level. However, if the mean [IP3]cyt is raised, [Ca2+]cyt oscillations can occur in the absence of positive feedback of Ca2+ on PLC (see Figure 8).
Fig. 7
Fig. 7
Test to see if positive feedback of Ca2+ on PLC is involved with [Ca2+]cyt oscillations. An applied IP3 pulse as shown results in different behaviors in the models with and without positive feedback of Ca2+ on PLC. In both cases the [Ca2+]cyt oscillation frequency increases with the increased [IP3]cyt. A. In the model with positive feedback of Ca2+ on PLC, the oscillations resume similar to those before the pulse. B. In the model without positive feedback of Ca2+ on PLC, the [Ca2+]cyt oscillations do not resume. C. The time course for activated [PLC] shows differing dynamics in the system with Ca2+ feedback on PLC (black) and without Ca2+ feedback on PLC (red).
Fig. 8
Fig. 8
Bifurcation diagrams for Ca2+ oscillations (——) indicates stable steady states and (-------) gives maximum and minimum [Ca2+]cyt during oscillations. A. The model generates oscillations in Ca2+ while [PLC*] between 1 and 4.2 µM. B. The constant IP3 ([IP3] + [IP3β]) between 0.8 and 4.4 µM can produce Ca2+ oscillations. C. [DAG] can affect Ca2+ oscillations when set [DAG] to a constant in between 0.0 and 2.0 µM.

References

    1. Swillens S, Mercan D. Computer simulation of a cytosolic calcium oscillator. Biochem J. 1990;271(3):835–838. - PMC - PubMed
    1. De Young GW, Keizer J. A single-pool inositol 1,4,5-trisphosphate-receptor-based model for agonist-stimulated oscillations in Ca2+ concentration. Proc Natl Acad Sci U S A. 1992;89(20):9895–9899. - PMC - PubMed
    1. Jafri MS, Keizer J. On the roles of Ca2+ diffusion, Ca2+ buffers, and the endoplasmic reticulum in IP3-induced Ca2+ waves. Biophysical journal. 1995;69(5):2139–2153. - PMC - PubMed
    1. Sinnecker D, Schaefer M. Real-time analysis of phospholipase C activity during different patterns of receptor-induced Ca2+ responses in HEK293 cells. Cell calcium. 2004;35(1):29–38. - PubMed
    1. McCullar JS, Malencik DA, Vogel WK, Crofoot KM, Anderson SR, Filtz TM. Calmodulin potentiates Gβγ activation of phospholipase C-β3. Biochem Pharmacol. 2007;73(2):270–278. - PMC - PubMed

LinkOut - more resources