Comparative Study
. 2016 May 24:5:e13288.
doi: 10.7554/eLife.13288.

Comparative genomics explains the evolutionary success of reef-forming corals

Affiliations
Comparative Study

Comparative genomics explains the evolutionary success of reef-forming corals

Debashish Bhattacharya et al. Elife. .

Abstract

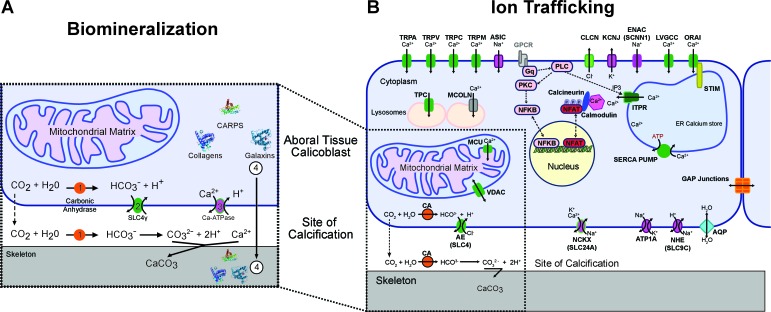
Transcriptome and genome data from twenty stony coral species and a selection of reference bilaterians were studied to elucidate coral evolutionary history. We identified genes that encode the proteins responsible for the precipitation and aggregation of the aragonite skeleton on which the organisms live, and revealed a network of environmental sensors that coordinate responses of the host animals to temperature, light, and pH. Furthermore, we describe a variety of stress-related pathways, including apoptotic pathways that allow the host animals to detoxify reactive oxygen and nitrogen species that are generated by their intracellular photosynthetic symbionts, and determine the fate of corals under environmental stress. Some of these genes arose through horizontal gene transfer and comprise at least 0.2% of the animal gene inventory. Our analysis elucidates the evolutionary strategies that have allowed symbiotic corals to adapt and thrive for hundreds of millions of years.

Keywords: biomineralization; corals; ecology; evolutionary biology; genomics; horizontal gene transfer; stress response; symbiosis.


Conflict of interest statement

PGF: Reviewing editor, eLife.

The other authors declare that no competing interests exist.

Figures

Figure 1.
Figure 1.. Multigene maximum likelihood (RAxML) tree inferred from an alignment of 391 orthologs (63,901 aligned amino acid positions) distributed among complete genome (boldface taxon names) and genomic data from 20 coral species and 12 outgroups.
The PROTGAMMALGF evolutionary model was used to infer the tree with branch support estimated with 100 bootstrap replicates. Robust and complex corals are shown in brown and green text, respectively, and non-coral metazoan species are shown in blue text. DOI: http://dx.doi.org/10.7554/eLife.13288.003
Figure 2.
Figure 2.. The mechanism of (A) coral biomineralization based on data from physiological and molecular approaches and (B) the major components of the human ion trafficking system that were identified in the coral genomic data (Figure 2—source data 1 for details).
Here, in (A) Biomineralization, 1 = carbonic anhydrases (orange); 2 = bicarbonate transporter (green); 3 = calcium-ATPase (purple); 4 = organic matrix proteins (shown as protein structures). DOI: http://dx.doi.org/10.7554/eLife.13288.005
Figure 2—figure supplement 1.
Figure 2—figure supplement 1.. Bayesian consensus trees of SLC26.
Bayesian posterior probabilities are indicated when greater than 50%. For this analysis and for the trees shown in Figure 2—figure supplements 2–4, MrBayes v3.1.2 was used with a random starting tree and the LG model of amino acid substitution. Trees were generated for 6,000,000 generations and sampled every 1000 generations with four chains to obtain the consensus tree and to determine the posterior probabilities at the internal nodes. DOI: http://dx.doi.org/10.7554/eLife.13288.007
Figure 2—figure supplement 2.
Figure 2—figure supplement 2.. Bayesian consensus trees of SLC4.
Bayesian posterior probabilities (×100) are indicated when greater than 50%. DOI: http://dx.doi.org/10.7554/eLife.13288.008
Figure 2—figure supplement 3.
Figure 2—figure supplement 3.. Bayesian consensus trees of Cav.
Bayesian posterior probabilities (×100) are indicated when greater than 50%. DOI: http://dx.doi.org/10.7554/eLife.13288.009
Figure 2—figure supplement 4.
Figure 2—figure supplement 4.. Bayesian consensus trees of coral and outgroup Ca-ATPase proteins.
Bayesian posterior probabilities (×100) are indicated when greater than 50%. DOI: http://dx.doi.org/10.7554/eLife.13288.010
Figure 2—figure supplement 5.
Figure 2—figure supplement 5.. Evolution of CARPs and other coral acid-rich proteins.
(A) Maximum likelihood (RAxML) tree showing extensive history of duplication of genes encoding CARP 5 that predates the split of robust (brown text) and complex (green text) corals. (B) RAxML tree showing the origin of CARP 1 in robust (brown text) and complex (green text) corals from a reticulocalbin-like ancestor by the evolution of a novel acid-rich N-terminaldomain. The non-coral species in both trees are shown in blue text. DOI: http://dx.doi.org/10.7554/eLife.13288.011
Figure 2—figure supplement 6.
Figure 2—figure supplement 6.. Scatter plot of isoelectric points of collagens from Seriatopora, Stylophora, Nematostella, and Crassostrea gigas.
DOI: http://dx.doi.org/10.7554/eLife.13288.012
Figure 2—figure supplement 7.
Figure 2—figure supplement 7.. Maximum likelihood (ML) trees of galaxin and amgalaxin.
(A) ML tree of best galaxin hits from 19 coral species (brown for robust corals and green for complex corals) and 11 non-coral species (blue text). (B) ML tree of best amgalaxin hits from 13 coral species. No outgroup blast hits were found against the acidic region of Acropora millepora amgalaxin 1 or 2 (Genbank accession numbers ADI50284.1 and ADI50285.1, respectively). DOI: http://dx.doi.org/10.7554/eLife.13288.013
Figure 3.
Figure 3.. Comparison of robust coral (brown text) and complex coral (green text) and non-coral (blue text) genomes with respect to percent of encoded proteins that contain either >30% or >40% negatively charged amino acid residues (i.e., aspartic acid [D] and glutamic acid [E]).
The average composition and standard deviation of D + E is shown for the two cut-offs of these estimates. On average, corals contain >2-fold more acidic residues than non-corals. This acidification of the coral proteome is postulated to result from the origin of biomineralization in this lineage. DOI: http://dx.doi.org/10.7554/eLife.13288.014
Figure 4.
Figure 4.. Analysis of a genomic region in Acropora digitifera that encodes a putative HGT candidate.
(A) The genome region showing the position of the HGT candidate (PNK3P) and its flanking genes. (B) Maximum likelihood trees of PNK3P (polynucleotide kinase 3 phosphatase, pfam08645) domain-containing protein and the proteins (RNA-binding and GTP-binding proteins) encoded by the flanking genes. Robust and complex corals are shown in brown and green text, respectively, and non-coral metazoan and choanoflagellate species are shown in blue text. Photosynthetic lineages, regardless of phylogenetic origin, are shown in magenta text and all other taxa are in black text. GenBank accession (GI) or other identifying numbers are shown for each sequence. The PNK3P domain plays a role in the repair of DNA single-strand breaks by removing single-strand 3'-end-blocking phosphates (Petrucco et al., 2002). DOI: http://dx.doi.org/10.7554/eLife.13288.015
Figure 4—figure supplement 1.
Figure 4—figure supplement 1.. Maximum likelihood trees of a DEAD-like helicase and the protein encoded by the flanking gene.
The bacterium-derived DEAD-like helicase genes in coral are nested within bacterial sequences, whereas the upstream host-derived gene (encoding mannosyl-oligosaccharide 1,2-alpha-mannosidase IB) is monophyletic with homologous genes from other metazoan species. The downstream Acropora digitifera-specific gene has no detectable homolog in other species. Robust and complex corals are shown in brown and green text, respectively, and non-coral metazoan and choanoflagellate species are shown in blue text. Photosynthetic lineages, regardless of phylogenetic origin, are shown in magenta text and all other taxa are in black text. GenBank accession (GI) or other identifying numbers are shown for each sequence. DOI: http://dx.doi.org/10.7554/eLife.13288.016
Figure 4—figure supplement 2.
Figure 4—figure supplement 2.. Maximum likelihood tree of an exonuclease-endonucease-phosphatase (EEP) domain-containing protein (A), an ATP-dependent endonuclease (B), a tyrosyl-DNA phosphodiesterase 2-like protein (C), and DNA mismatch repair (MutS-like) protein (D).
Robust and complex corals are shown in brown and green text, respectively, and non-coral metazoan and choanoflagellate species are shown in blue text. Photosynthetic lineages, regardless of phylogenetic origin, are shown in magenta text and all other taxa are in black text. GenBank accession (GI) or other identifying numbers are shown for each sequence. DOI: http://dx.doi.org/10.7554/eLife.13288.017
Figure 4—figure supplement 3.
Figure 4—figure supplement 3.. Maximum likelihood trees of glyoxalase I (or lactoylglutathione lyase) and the proteins encoded by the flanking genes (top image) in Acropora digitifera.
Robust and complex corals are shown in brown and green text, respectively, and non-coral metazoan and choanoflagellate species are shown in blue text. Photosynthetic lineages, regardless of phylogenetic origin, are shown in magenta text and all other taxa are in black text. GenBank accession (GI) or other identifying numbers are shown for each sequence. DOI: http://dx.doi.org/10.7554/eLife.13288.018
Figure 4—figure supplement 4.
Figure 4—figure supplement 4.. Maximum likelihood tree of a second glyoxalase I (or lactoylglutathione lyase) and the proteins encoded by the flanking genes (top image) in Acropora digitifera.
The coral glyoxalase gene gene was derived from a bacteria-specific gene type. Robust and complex corals are shown in brown and green text, respectively, and non-coral metazoan and choanoflagellate species are shown in blue text. Photosynthetic lineages, regardless of phylogenetic origin, are shown in magenta text and all other taxa are in black text. GenBank accession (GI) or other identifying numbers are shown for each sequence. DOI: http://dx.doi.org/10.7554/eLife.13288.019
Figure 4—figure supplement 5.
Figure 4—figure supplement 5.. Maximum likelihood tree of an algal-derived short-chain dehydrogenase/reductase (A), and a dinoflagellate-derived phosphonoacetaldehyde hydrolase (B).
Robust and complex corals are shown in brown and green text, respectively, and non-coral metazoan and choanoflagellate species are shown in blue text. Photosynthetic lineages, regardless of phylogenetic origin, are shown in magenta text and all other taxa are in black text. GenBank accession (GI) or other identifying numbers are shown for each sequence. DOI: http://dx.doi.org/10.7554/eLife.13288.020

References

    1. Allison N, Cohen I, Finch AA, Erez J, Tudhope AW, Edinburgh Ion Microprobe Facility Corals concentrate dissolved inorganic carbon to facilitate calcification. Nature Communications. 2014;5:5741. doi: 10.1038/ncomms6741. - DOI - PubMed
    1. Altschul SF, Gish W, Miller W, Myers EW, Lipman DJ. Basic local alignment search tool. Journal of Molecular Biology. 1990;215:403–410. doi: 10.1016/S0022-2836(05)80360-2. - DOI - PubMed
    1. Bairoch A, Apweiler R. The SWISS-PROT protein sequence database and its supplement TrEMBL in 2000. Nucleic Acids Research. 2000;28:45–48. doi: 10.1093/nar/28.1.45. - DOI - PMC - PubMed
    1. Banaszak AT, Lesser MP. Effects of solar ultraviolet radiation on coral reef organisms. Photochemical & Photobiological Sciences. 2009;8:1276–1294. doi: 10.1039/b902763g. - DOI - PubMed
    1. Bateman A, Birney E, Cerruti L, Durbin R, Etwiller L, Eddy SR, Griffiths-Jones S, Howe KL, Marshall M, Sonnhammer EL. The pfam protein families database. Nucleic Acids Research. 2002;30:276–280. doi: 10.1093/nar/30.1.276. - DOI - PMC - PubMed

Publication types

MeSH terms

LinkOut - more resources