Review
. 2016 Oct 1;594(19):5415-26.
doi: 10.1113/JP272556. Epub 2016 Jul 21.

Why are rods more sensitive than cones?

Affiliations
Review

Why are rods more sensitive than cones?

Norianne T Ingram et al. J Physiol. .

Abstract

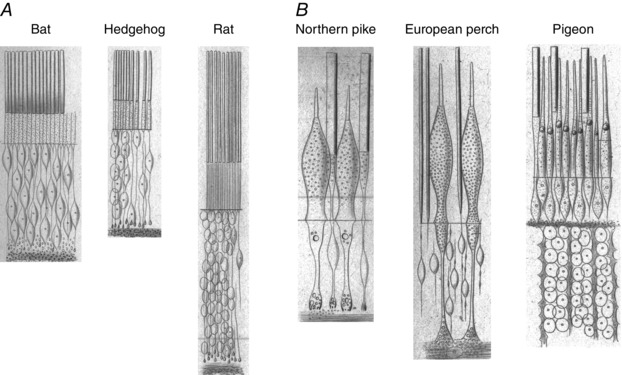
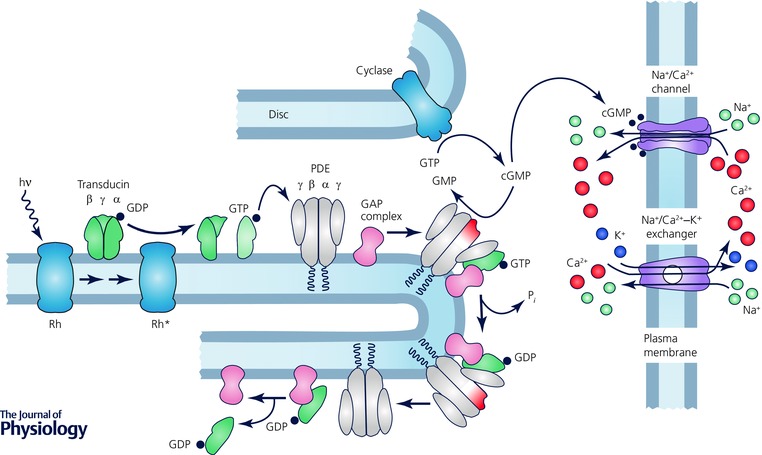
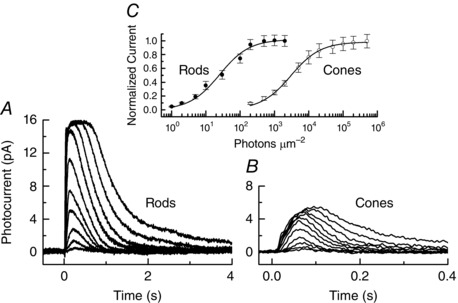
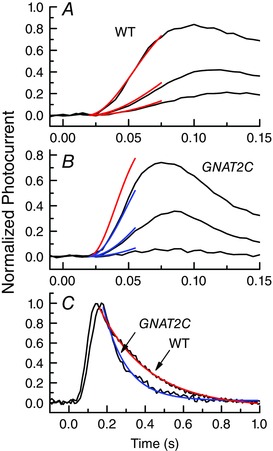
One hundred and fifty years ago Max Schultze first proposed the duplex theory of vision, that vertebrate eyes have two types of photoreceptor cells with differing sensitivity: rods for dim light and cones for bright light and colour detection. We now know that this division is fundamental not only to the photoreceptors themselves but to the whole of retinal and visual processing. But why are rods more sensitive, and how did the duplex retina first evolve? Cells resembling cones are very old, first appearing among cnidarians; the emergence of rods was a key step in the evolution of the vertebrate eye. Many transduction proteins have different isoforms in rods and cones, and others are expressed at different levels. Moreover rods and cones have a different anatomy, with only rods containing membranous discs enclosed by the plasma membrane. These differences must be responsible for the difference in absolute sensitivity, but which are essential? Recent research particularly expressing cone proteins in rods or changing the level of expression seem to show that many of the molecular differences in the activation and decay of the response may have each made a small contribution as evolution proceeded stepwise with incremental increases in sensitivity. Rod outer-segment discs were not essential and developed after single-photon detection. These experiments collectively provide a new understanding of the two kinds of photoreceptors and help to explain how gene duplication and the formation of rod-specific proteins produced the duplex retina, which has remained remarkably constant in physiology from amphibians to man.

Keywords: cones; photoreceptor; rhodopsin; rods; vision.


Figures

Figure 1
Figure 1. Rods and cones in nocturnal and diurnal animals
Drawings from Schultze's original paper (1866) of photoreceptors from nocturnal animals (A) and diurnal animals (B), magnification approximately 350–400 times. Schultze claimed that the bat retina lacked even a trace of cones, but in rat he noticed occasional gaps (Lücken) which he speculated could possibly correspond to cones, as we now know to be true. Fish and pigeon on the other hand have many easily observable cones in addition to rods. Schultze commented that these observations ‘would seem to indicate that rods are more advantageous than cones for quantitative light perception’, but that ‘cones would seem to be the nerve end‐organs for colour perception’.
Figure 2
Figure 2. Phototransduction in vertebrate photoreceptors
Redrawn and printed with permission from Fain et al. (2010).
Figure 3
Figure 3. Responses of mouse rods and cones
A, mean responses of 11 WT mouse rods to 20 ms flashes of 500 nm illumination from 0.5 to 2000 photons μm−2. B, mean responses of 18 mouse M (508 nm) cones to 20 ms flashes of 500 nm illumination from 200 to 500,000 photons μm−2. Responses in A and B were filtered with an 8‐pole Bessel filter with a low‐pass filter setting of 75 Hz. C, mean peak amplitudes (with SEM) of responses of mouse rods (●) and mouse cones (○) to 20 ms flashes of 500 nm illumination, normalized to maximum response and plotted as a function of flash intensity. Curves give best‐fitting Michaelis–Menten equation with flash intensities at half‐maximal amplitude of 25.3 (for rods) and 2960 (for cones) photons μm−2. All recordings were made from C57BL/6 mice from Jackson Laboratory (Bar Harbor, ME, USA), dark adapted for at least 4 h and usually overnight. All experiments were performed on mice of either sex in accordance with the rules and regulations of the NIH guidelines for research animals, as approved by the institutional animal care and use committee (IACUC) of the University of California, Los Angeles. Animals were kept in cyclic 12 h/12 h on/off lighting in approved cages and supplied with ample food and water. Animals in all experiments were killed before tissue extraction by approved procedures, usually CO2 inhalation or decerebration. Recordings were made at 37°C in Ames solution. Light intensities are given as photons effective at the lambda max of the rod or cone pigment calculated by convolving the spectrum of the stimulating beam with the rod or cone photopigment absorption curves.
Figure 4
Figure 4. Differences in rate of activation and decay of WT and GNAT2C rods
A, black traces are mean initial time courses of responses of 16 WT rods to 10 ms flashes at intensities of 8.6, 21 and 79 photons μm−2, after filtering with an 8‐pole Bessel filter with a low‐pass filter setting of 70 Hz. Responses have been normalized to the peak amplitude of the response. Red traces are fits to the data of the function rrmax=1exp[12IA(tt eff )2] where r/r max is the normalized flash response, I is the flash intensity in photoisomerizations, A is the amplification constant, t is time, and t eff is the effective delay time of transduction (Pugh & Lamb, 1993), with the same mean values of A of 20.5 s−2 and t eff of 18 ms at all three intensities. B, black traces are mean initial time courses of responses recorded and normalized as in A but of 14 GNAT2C rods to 10 ms flashes at intensities of 21, 79 and 227 photons μm−2. Blue traces are fits to the data with an A of 10.2 s−2 and t eff of 19.3 ms. Single red curve gives prediction for brightest intensity with WT rod value of A (20.5 s−2). The value of A is about two times smaller in GNAT2C rods. C, mean small‐amplitude responses of 21 WT rods and 9 GNAT2C rods to flashes of intensities 17 photons μm−2 (WT) and 79 photons μm−2 (GNAT2C). Responses have been normalized rod by rod to the peak amplitude of the response to compare waveforms of response decay. Responses have been fitted with single exponentials of 258 ms (red trace, WT) and 122 ms (blue trace, GNAT2C). Responses of GNAT2C rods decay significantly more rapidly. (Panels A–C reprinted with permission from Chen et al. 2010 b).
Figure 5
Figure 5. Single‐photon responses of mouse rods with altered transduction proteins
A, derived average single‐photon responses from control rods (black; rod PDE6) and cone‐PDE6C‐expressing rods (red; cone PDE6) (redrawn and reprinted with permission from Majumder et al. 2015). B, superimposed single‐photon responses of WT mouse rods and of R9AP95 rods with six times the normal expression of GAP proteins (Chen et al. 2010 a). Responses were plotted as a fraction of the peak current of the rod, effectively giving the fraction of channels closed per photon. Recordings were made from animals on a GCAPs−/− background to remove the effects of cyclase modulation on response amplitude and waveform (Gross et al. 2012). All experiments were performed on pigmented mice of either sex in accordance with the rules and regulations of the NIH guidelines for research animals, as approved by the institutional animal care and use committees (IACUCs) of the Virginia Commonwealth University and the University of California, Los Angeles. Animals were kept in cyclic 12 h/12 h on/off lighting in approved cages and supplied with ample food and water. Animals in all experiments were killed before tissue extraction by approved procedures, usually CO2 inhalation or decerebration. Rods were perfused at 37°C with Dulbecco's modified Eagle's medium (Sigma Chemical, St Louis, MO, USA), supplemented with 15 mm NaHCO3, 2 mm sodium succinate, 0.5 mm sodium glutamate, 2 mm sodium gluconate, and 5 mm NaCl, bubbled with 95% O2–5% CO2 (pH 7.4). Unless otherwise indicated, data were filtered at 35 Hz (8 pole, Bessel) and sampled at 100 Hz. (M. L. Woodruff, C. K. Chen & G. L. Fain, unpublished data).

References

    1. Angueyra JM & Rieke F (2013). Origin and effect of phototransduction noise in primate cone photoreceptors. Nat Neurosci 16, 1692–1700. - PMC - PubMed
    1. Arshavsky VY & Wensel TG (2013). Timing is everything: GTPase regulation in phototransduction. Invest Ophthalmol Vis Sci 54, 7725–7733. - PMC - PubMed
    1. Asteriti S, Grillner S & Cangiano L (2015). A Cambrian origin for vertebrate rods. Elife 4, e07166. - PMC - PubMed
    1. Baehr W, Karan S, Maeda T, Luo DG, Li S, Bronson JD, Watt CB, Yau KW, Frederick JM & Palczewski K (2007). The function of guanylate cyclase 1 and guanylate cyclase 2 in rod and cone photoreceptors. J Biol Chem 282, 8837–8847. - PMC - PubMed
    1. Baylor DA, Lamb TD & Yau KW (1979). Responses of retinal rods to single photons. J Physiol 288, 613–634. - PMC - PubMed

Publication types

MeSH terms

Substances