

A Systematic Comparison of Linear Regression-Based Statistical Methods to Assess Exposome-Health Associations
- PMID: 27219331
- PMCID: PMC5132632
- DOI: 10.1289/EHP172
A Systematic Comparison of Linear Regression-Based Statistical Methods to Assess Exposome-Health Associations
Abstract
Background: The exposome constitutes a promising framework to improve understanding of the effects of environmental exposures on health by explicitly considering multiple testing and avoiding selective reporting. However, exposome studies are challenged by the simultaneous consideration of many correlated exposures.
Objectives: We compared the performances of linear regression-based statistical methods in assessing exposome-health associations.
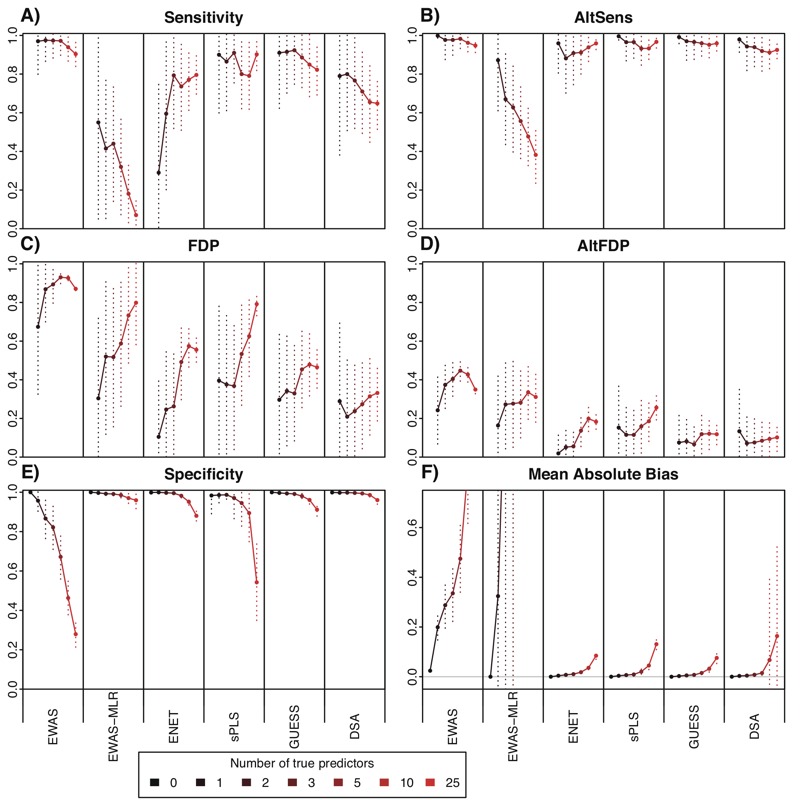
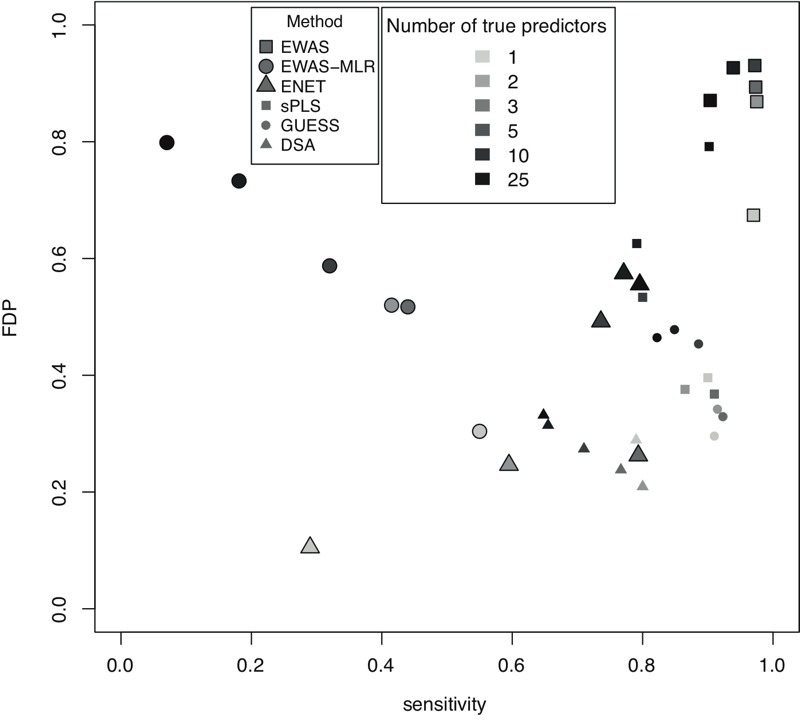
Methods: In a simulation study, we generated 237 exposure covariates with a realistic correlation structure and with a health outcome linearly related to 0 to 25 of these covariates. Statistical methods were compared primarily in terms of false discovery proportion (FDP) and sensitivity.
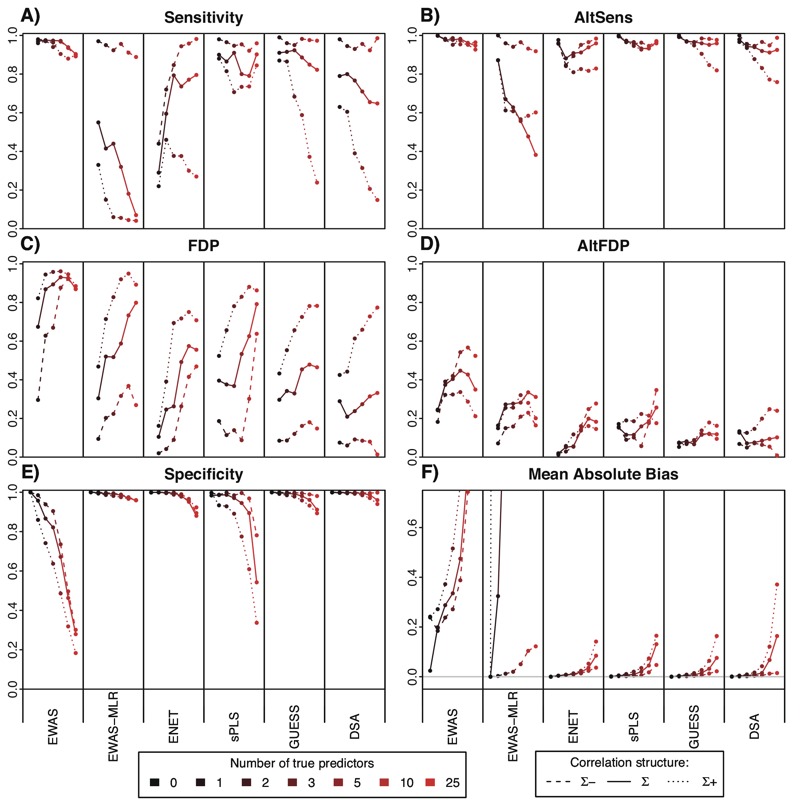
Results: On average over all simulation settings, the elastic net and sparse partial least-squares regression showed a sensitivity of 76% and an FDP of 44%; Graphical Unit Evolutionary Stochastic Search (GUESS) and the deletion/substitution/addition (DSA) algorithm revealed a sensitivity of 81% and an FDP of 34%. The environment-wide association study (EWAS) underperformed these methods in terms of FDP (average FDP, 86%) despite a higher sensitivity. Performances decreased considerably when assuming an exposome exposure matrix with high levels of correlation between covariates.
Conclusions: Correlation between exposures is a challenge for exposome research, and the statistical methods investigated in this study were limited in their ability to efficiently differentiate true predictors from correlated covariates in a realistic exposome context. Although GUESS and DSA provided a marginally better balance between sensitivity and FDP, they did not outperform the other multivariate methods across all scenarios and properties examined, and computational complexity and flexibility should also be considered when choosing between these methods. Citation: Agier L, Portengen L, Chadeau-Hyam M, Basagaña X, Giorgis-Allemand L, Siroux V, Robinson O, Vlaanderen J, González JR, Nieuwenhuijsen MJ, Vineis P, Vrijheid M, Slama R, Vermeulen R. 2016. A systematic comparison of linear regression-based statistical methods to assess exposome-health associations. Environ Health Perspect 124:1848-1856; http://dx.doi.org/10.1289/EHP172.
Conflict of interest statement
The authors declare they have no actual or potential competing financial interests.
Figures
References
-
- Benjamini Y, Hochberg Y. Controlling the false discovery rate: a practical and powerful approach to multiple testing. J R Stat Soc Series B Stat Methodol. 1995;57:289–300.
-
- Benjamini Y, Yekutieli D. The control of the false discovery rate in multiple testing under dependency. Ann Stat. 2001;29:1165–1188.
-
- Bonferroni CE. Teoria statistica delle classi e calcolo delle probabilità [in Italian]. Pubbl del R Ist Super di Sci Econ e Commer di Firenze. 1936;8:3–62.
-
- Bottolo L, Richardson S. Evolutionary stochastic search for Bayesian model exploration. Bayesian Anal. 2010;5:583–618.
Publication types
MeSH terms
Substances
LinkOut - more resources
Full Text Sources
Other Literature Sources