

Inhibition in the Human Auditory Cortex
- PMID: 27219470
- PMCID: PMC4878756
- DOI: 10.1371/journal.pone.0155972
Inhibition in the Human Auditory Cortex
Expression of concern in
-
Expression of Concern: Inhibition in the Human Auditory Cortex.PLoS One. 2023 Jan 11;18(1):e0279799. doi: 10.1371/journal.pone.0279799. eCollection 2023. PLoS One. 2023. PMID: 36630337 Free PMC article. No abstract available.
Abstract
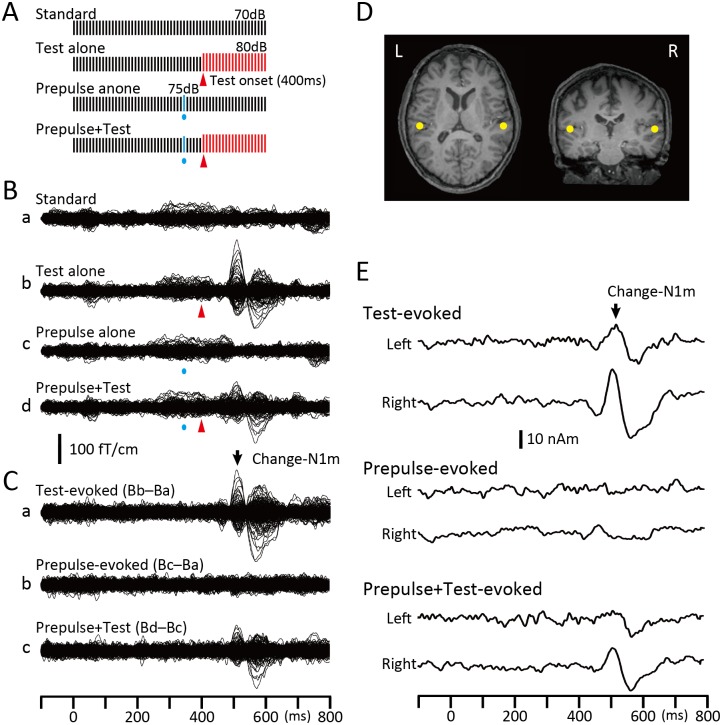
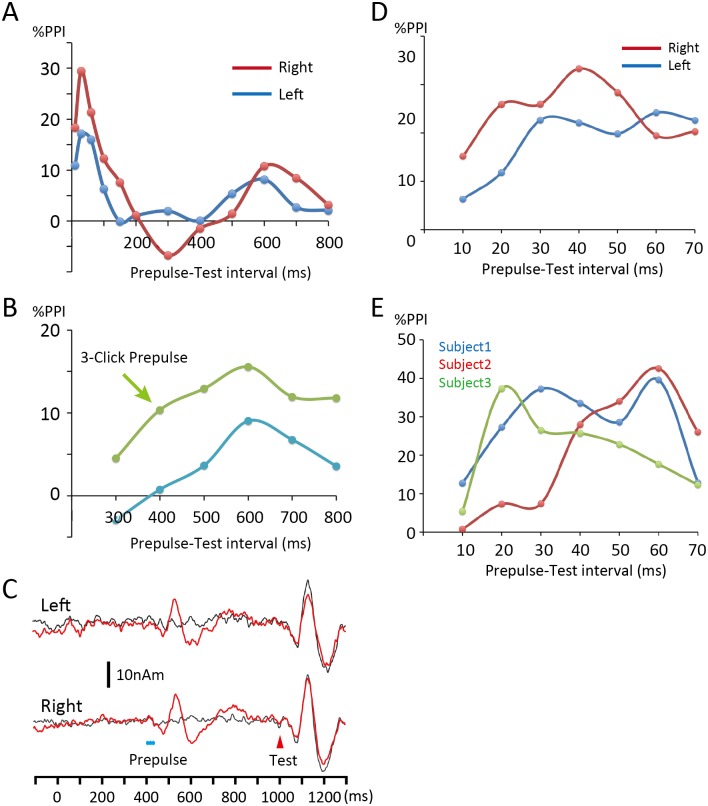
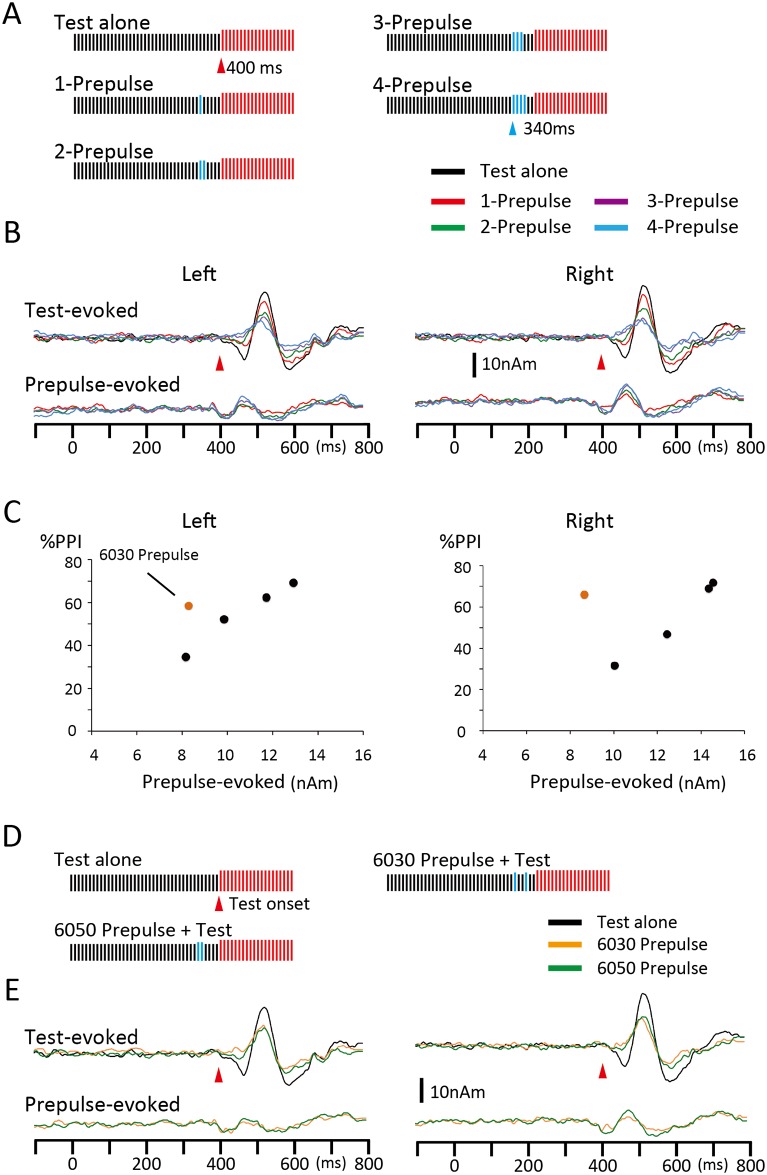
Despite their indispensable roles in sensory processing, little is known about inhibitory interneurons in humans. Inhibitory postsynaptic potentials cannot be recorded non-invasively, at least in a pure form, in humans. We herein sought to clarify whether prepulse inhibition (PPI) in the auditory cortex reflected inhibition via interneurons using magnetoencephalography. An abrupt increase in sound pressure by 10 dB in a continuous sound was used to evoke the test response, and PPI was observed by inserting a weak (5 dB increase for 1 ms) prepulse. The time course of the inhibition evaluated by prepulses presented at 10-800 ms before the test stimulus showed at least two temporally distinct inhibitions peaking at approximately 20-60 and 600 ms that presumably reflected IPSPs by fast spiking, parvalbumin-positive cells and somatostatin-positive, Martinotti cells, respectively. In another experiment, we confirmed that the degree of the inhibition depended on the strength of the prepulse, but not on the amplitude of the prepulse-evoked cortical response, indicating that the prepulse-evoked excitatory response and prepulse-evoked inhibition reflected activation in two different pathways. Although many diseases such as schizophrenia may involve deficits in the inhibitory system, we do not have appropriate methods to evaluate them; therefore, the easy and non-invasive method described herein may be clinically useful.
Conflict of interest statement
Figures
Similar articles
-
Prepulse Inhibition of the Auditory Off-Response: A Magnetoencephalographic Study.Clin EEG Neurosci. 2018 May;49(3):152-158. doi: 10.1177/1550059417708914. Epub 2017 May 10. Clin EEG Neurosci. 2018. PMID: 28490194
-
Prepulse inhibition of auditory change-related cortical responses.BMC Neurosci. 2012 Oct 31;13:135. doi: 10.1186/1471-2202-13-135. BMC Neurosci. 2012. PMID: 23113968 Free PMC article.
-
Effects of acute nicotine on prepulse inhibition of auditory change-related cortical responses.Behav Brain Res. 2013 Nov 1;256:27-35. doi: 10.1016/j.bbr.2013.07.045. Epub 2013 Aug 6. Behav Brain Res. 2013. PMID: 23933145
-
Residual inhibition: From the putative mechanisms to potential tinnitus treatment.Hear Res. 2019 Apr;375:1-13. doi: 10.1016/j.heares.2019.01.022. Epub 2019 Feb 1. Hear Res. 2019. PMID: 30822633 Review.
-
Inhibition in the auditory cortex.Neurosci Biobehav Rev. 2022 Jan;132:61-75. doi: 10.1016/j.neubiorev.2021.11.021. Epub 2021 Nov 22. Neurosci Biobehav Rev. 2022. PMID: 34822879 Review.
Cited by
-
Cortico-cortical connectivity behind acoustic information transfer to mouse orbitofrontal cortex is sensitive to neuromodulation and displays local sensory gating: relevance in disorders with auditory hallucinations?J Psychiatry Neurosci. 2021 May 27;46(3):E371-E387. doi: 10.1503/jpn.200131. J Psychiatry Neurosci. 2021. PMID: 34043305 Free PMC article.
-
The Effects of Attention on the Syllable-Induced Prepulse Inhibition of the Startle Reflex and Cortical EEG Responses against Energetic or Informational Masking in Humans.Brain Sci. 2022 May 18;12(5):660. doi: 10.3390/brainsci12050660. Brain Sci. 2022. PMID: 35625046 Free PMC article.
-
Long-latency suppression of auditory and somatosensory change-related cortical responses.PLoS One. 2018 Jun 26;13(6):e0199614. doi: 10.1371/journal.pone.0199614. eCollection 2018. PLoS One. 2018. PMID: 29944700 Free PMC article.
-
Representation of amplified speech at cortical level in good and poor hearing aid performers.Braz J Otorhinolaryngol. 2020 Sep-Oct;86(5):558-567. doi: 10.1016/j.bjorl.2019.02.010. Epub 2019 Apr 23. Braz J Otorhinolaryngol. 2020. PMID: 31122881 Free PMC article.
-
Target Site of Prepulse Inhibition of the Trigeminal Blink Reflex in Humans.J Neurosci. 2023 Jan 11;43(2):261-269. doi: 10.1523/JNEUROSCI.1468-22.2022. Epub 2022 Nov 28. J Neurosci. 2023. PMID: 36443001 Free PMC article.
References
-
- DeFelipe J. Neocortical neuronal diversity: chemical heterogeneity revealed by colocalization studies of classic neurotransmitters, neuropeptides, calcium-binding proteins, and cell surface molecules. Cereb Cortex 1993;3:273–289. - PubMed
-
- Kawaguchi Y, Kubota Y. GABAergic cell subtypes and their synaptic connections in rat frontal cortex. Cereb Cortex 1997;7:476–486. - PubMed
-
- Thomson AM, Deuchars J. Synaptic interactions in neocortical local circuits: dual intracellular recordings in vitro. Cereb Cortex 1997;7:510–522. - PubMed
-
- Somogyi P, Tamás G, Lujan R, Buhl EH. Salient features of synaptic organisation in the cerebral cortex. Brain Res Brain Res Rev. 1998;26:113–135. - PubMed
Publication types
MeSH terms
LinkOut - more resources
Full Text Sources
Other Literature Sources
Miscellaneous
