

In vivo correlates of thermoregulatory defense in humans: Temporal course of sub-cortical and cortical responses assessed with fMRI
- PMID: 27220041
- PMCID: PMC6867576
- DOI: 10.1002/hbm.23233
In vivo correlates of thermoregulatory defense in humans: Temporal course of sub-cortical and cortical responses assessed with fMRI
Abstract
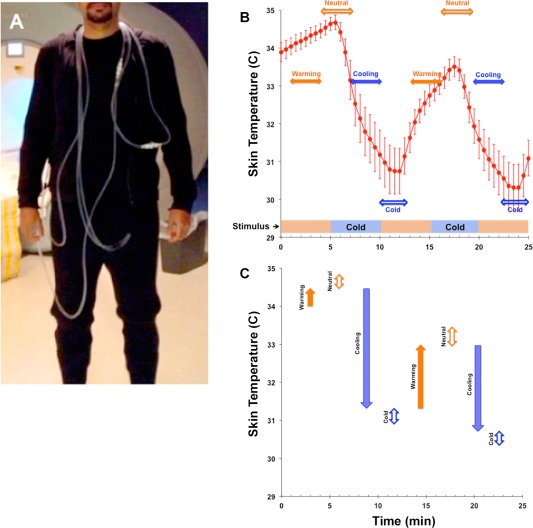
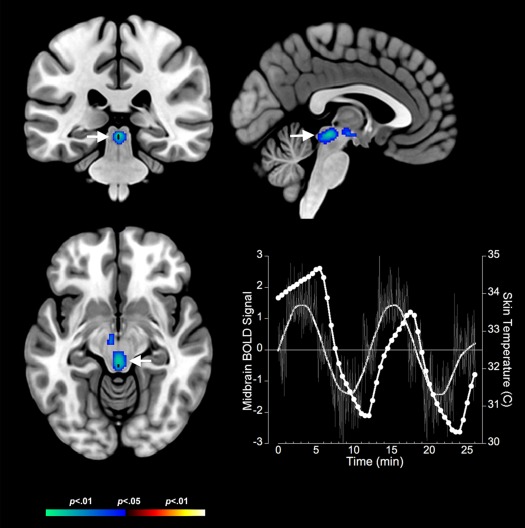
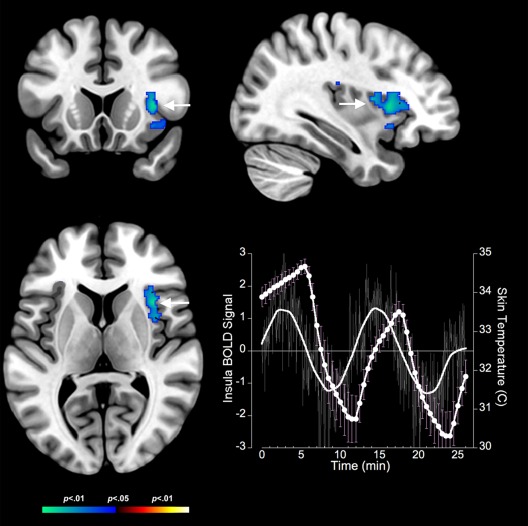
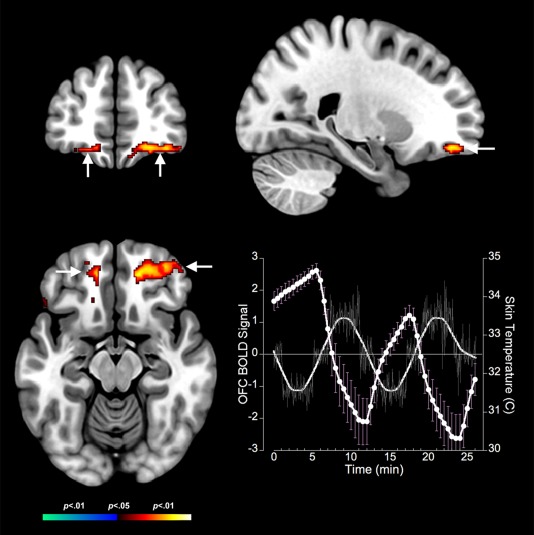
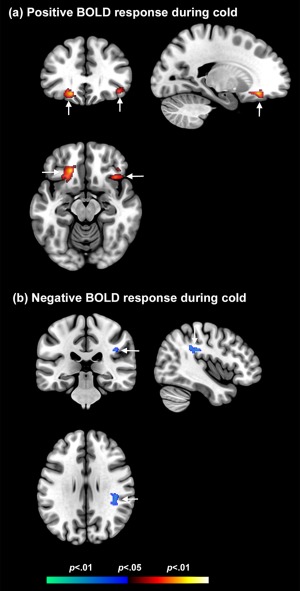
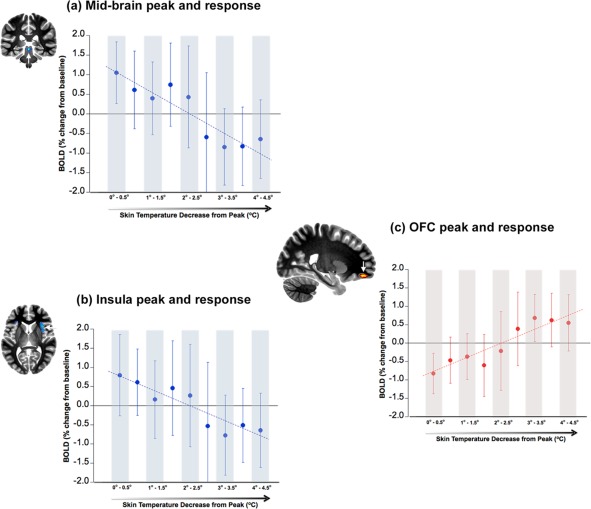
Extensive studies in rodents have established the role of neural pathways that are activated during thermoregulation. However, few studies have been conducted in humans to assess the complex, hierarchically organized thermoregulatory network in the CNS that maintains thermal homeostasis, especially as it pertains to cold exposure. To study the human thermoregulatory network during whole body cold exposure, we have used functional MRI to characterize changes in the BOLD signal within the constituents of the thermoregulatory network in 20 young adult controls during non-noxious cooling and rewarming of the skin by a water-perfused body suit. Our results indicate significant decreases of BOLD signal during innocuous whole body cooling stimuli in the midbrain, the right anterior insula, the right anterior cingulate, and the right inferior parietal lobe. Whereas brain activation in these areas decreased during cold exposure, brain activation increased significantly in the bilateral orbitofrontal cortex during this period. The BOLD signal time series derived from significant activation sites in the orbitofrontal cortex showed opposed phase to those observed in the other brain regions, suggesting complementary processing mechanisms during mild hypothermia. The significance of our findings lies in the recognition that whole body cooling evokes a response in a hierarchically organized thermoregulatory network that distinguishes between cold and warm stimuli. This network seems to generate a highly resolved interoceptive representation of the body's condition that provides input to the orbitofrontal cortex, where higher-order integration takes place and invests internal states with emotional significance that motivate behavior. Hum Brain Mapp 37:3188-3202, 2016. © 2016 Wiley Periodicals, Inc.
Keywords: cold stress; fMRI; insula; midbrain; orbitofrontal cortex; thermoregulation.
© 2016 Wiley Periodicals, Inc.
Figures
Similar articles
-
Regulation of Brown Adipose Tissue Activity by Interoceptive CNS Pathways: The interaction between Brain and Periphery.Front Neurosci. 2017 Nov 16;11:640. doi: 10.3389/fnins.2017.00640. eCollection 2017. Front Neurosci. 2017. PMID: 29200996 Free PMC article.
-
Directional Interactions Between Constituents of the Human Large-Scale Thermoregulatory Network.Brain Topogr. 2020 Jul;33(4):489-503. doi: 10.1007/s10548-020-00778-1. Epub 2020 Jun 4. Brain Topogr. 2020. PMID: 32500213
-
Effective connectivity of brain networks controlling human thermoregulation.Brain Struct Funct. 2022 Jan;227(1):299-312. doi: 10.1007/s00429-021-02401-w. Epub 2021 Oct 4. Brain Struct Funct. 2022. PMID: 34605996
-
Central neural substrates involved in temperature discrimination, thermal pain, thermal comfort, and thermoregulatory behavior.Handb Clin Neurol. 2018;156:317-338. doi: 10.1016/B978-0-444-63912-7.00019-9. Handb Clin Neurol. 2018. PMID: 30454598 Review.
-
Thermoregulatory disorders and illness related to heat and cold stress.Auton Neurosci. 2016 Apr;196:91-104. doi: 10.1016/j.autneu.2016.01.001. Epub 2016 Jan 6. Auton Neurosci. 2016. PMID: 26794588 Review.
Cited by
-
Regulation of Brown Adipose Tissue Activity by Interoceptive CNS Pathways: The interaction between Brain and Periphery.Front Neurosci. 2017 Nov 16;11:640. doi: 10.3389/fnins.2017.00640. eCollection 2017. Front Neurosci. 2017. PMID: 29200996 Free PMC article.
-
The Role of the Skin in Interoception: A Neglected Organ?Perspect Psychol Sci. 2023 Jan;18(1):224-238. doi: 10.1177/17456916221094509. Epub 2022 Aug 15. Perspect Psychol Sci. 2023. PMID: 35969893 Free PMC article.
-
Shivering thermogenesis in humans: Origin, contribution and metabolic requirement.Temperature (Austin). 2017 May 22;4(3):217-226. doi: 10.1080/23328940.2017.1328999. eCollection 2017. Temperature (Austin). 2017. PMID: 28944268 Free PMC article. Review.
-
Neural correlates of ambient thermal sensation: An fMRI study.Sci Rep. 2017 Sep 12;7(1):11279. doi: 10.1038/s41598-017-11802-z. Sci Rep. 2017. PMID: 28900235 Free PMC article.
-
Repeatability of brown adipose tissue measurements on FDG PET/CT following a simple cooling procedure for BAT activation.PLoS One. 2019 Apr 17;14(4):e0214765. doi: 10.1371/journal.pone.0214765. eCollection 2019. PLoS One. 2019. PMID: 30995248 Free PMC article.
References
-
- Almeida MC, Hew‐Butler T, Soriano RN, Rao S, Wang W, Wang J, Tamayo N, Oliveira DL, Nucci TB, Aryal P, Garami A, Bautista D, Gavva NR, Romanovsky AA (2012): Pharmacological blockade of the cold receptor TRPM8 attenuates autonomic and behavioral cold defenses and decreases deep body temperature. J Neurosci 32:2086–2099. - PMC - PubMed
-
- Angilletta MJ (2009) Thermal Adaptation: A Theoretical and Empirical Synthesis. Oxford: Oxford University Press.
-
- A Bechara, H Damasio, AR Damasio (2000): Emotion, decision making and the orbitofrontal cortex. Cereb Cortex; 10(3): 295–307. Review. - PubMed
-
- Bobillier P, Seguin S, Petitjean F, Salvert D, Touret M, Jouvet M (1976): The raphe nuclei of the cat brain stem: A topographical atlas of their efferent projections as revealed by autoradiography. Brain Res 113:449–486. - PubMed
Publication types
MeSH terms
Grants and funding
LinkOut - more resources
Full Text Sources
Other Literature Sources
