. 2016 May 24;13(1):117.
doi: 10.1186/s12974-016-0581-z.

Brain trauma elicits non-canonical macrophage activation states

Affiliations

Brain trauma elicits non-canonical macrophage activation states

Charles C Kim et al. J Neuroinflammation. .

Abstract

Background: Macrophage polarization programs, commonly referred to as "classical" and "alternative" activation, are widely considered as distinct states that are exclusive of one another and are associated with different functions such as inflammation and wound healing, respectively. In a number of disease contexts, such as traumatic brain injury (TBI), macrophage polarization influences the extent of pathogenesis, and efforts are underway to eliminate pathogenic subsets. However, previous studies have not distinguished whether the simultaneous presence of both classical and alternative activation signatures represents the admixture of differentially polarized macrophages or if they have adopted a unique state characterized by components of both classical and alternative activation.

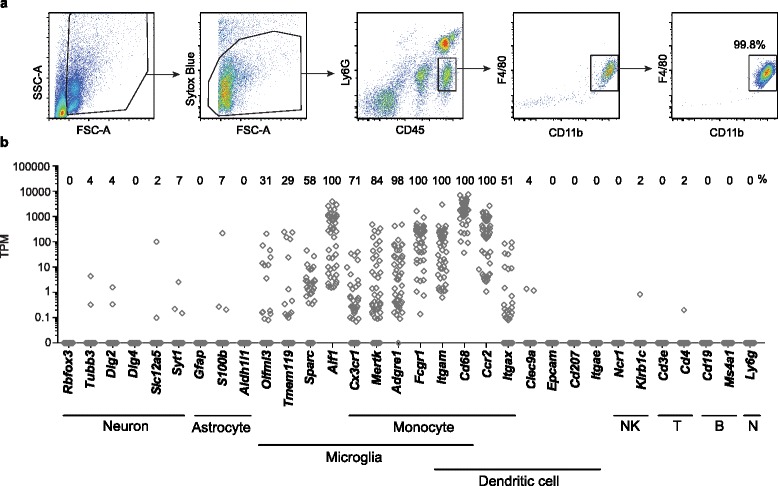
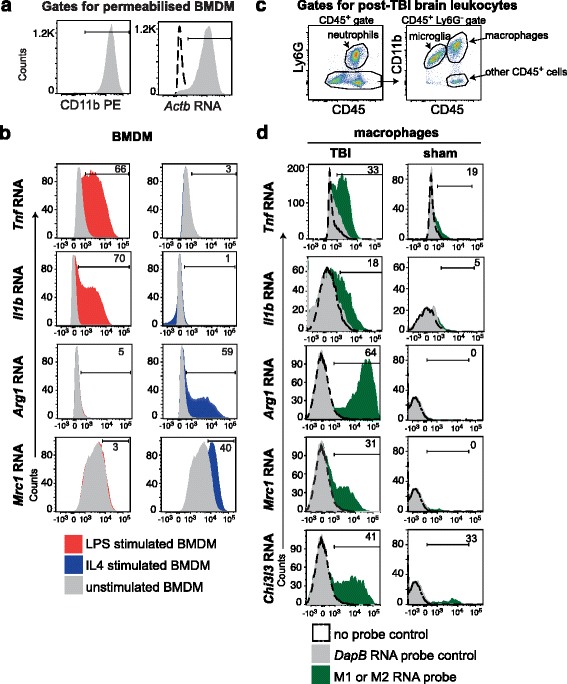
Methods: We analyzed the gene expression profiles of individual monocyte-derived brain macrophages responding to TBI using single-cell RNA sequencing. RNA flow cytometry was used as another single-cell analysis technique to validate the single-cell RNA sequencing results.

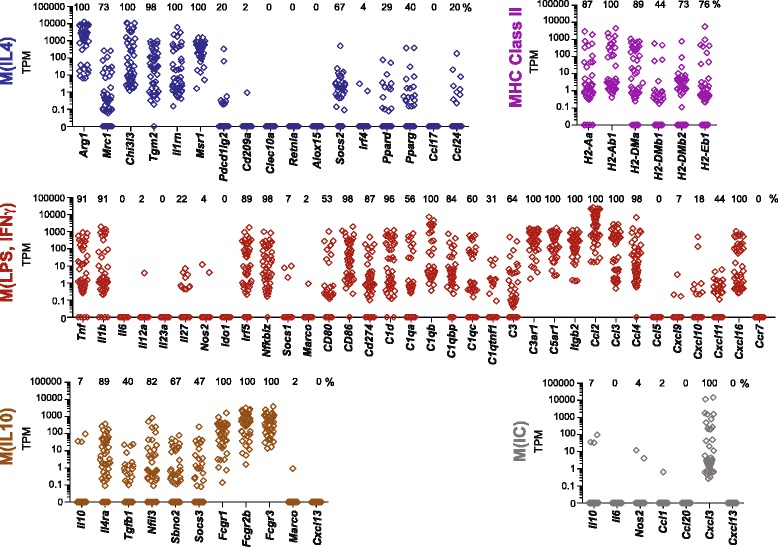
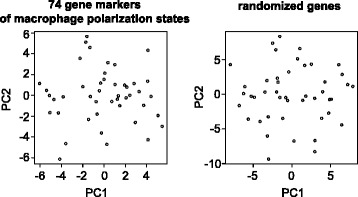
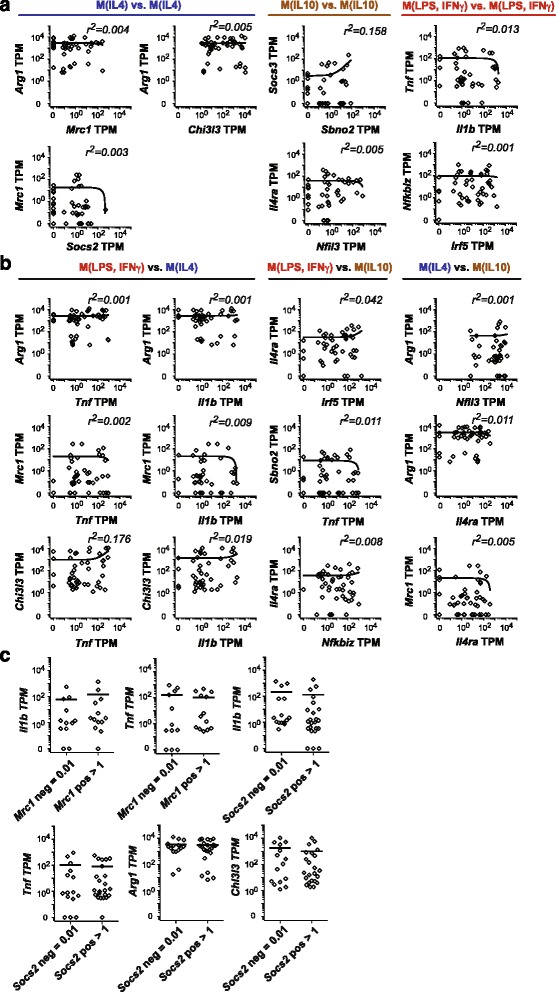
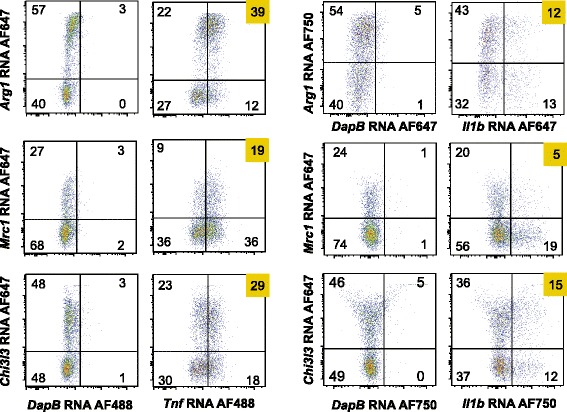
Results: The analysis of signature polarization genes by single-cell RNA sequencing revealed the presence of diverse activation states, including M(IL4), M(IL10), and M(LPS, IFNγ). However, the expression of a given polarization marker was no more likely than at random to predict simultaneous expression or repression of markers of another polarization program within the same cell, suggesting a lack of exclusivity in macrophage polarization states in vivo in TBI. Also unexpectedly, individual TBI macrophages simultaneously expressed high levels of signature polarization genes across two or three different polarization states and in several distinct and seemingly incompatible combinations.

Conclusions: Single-cell gene expression profiling demonstrated that monocytic macrophages in TBI are not comprised of distinctly polarized subsets but are uniquely and broadly activated. TBI macrophage activation in vivo is deeply complex, with individual cells concurrently adopting both inflammatory and reparative features with a lack of exclusivity. These data provide physiologically relevant evidence that the early macrophage response to TBI is comprised of novel activation states that are discordant with the current paradigm of macrophage polarization-a key consideration for therapeutic modulation.

Keywords: Innate immunity; Macrophage; Monocyte; Myeloid cells; Neuroinflammation; Neurotrauma; Polarization; RNA flow cytometry; Single-cell RNA sequencing; Traumatic brain injury.


Figures

Fig. 1
Fig. 1
Transcriptional profiles of lineage markers as determined by single-cell RNA sequencing of individual TBI macrophages. a Mouse leukocytes were harvested from pooled ipsilateral hemispheres of brain tissue 1 day post-TBI and cell sorted for macrophages by flow cytometry. Flow cytometry gates for cell sorting of live TBI macrophages (CD45hi Ly6G CD11b+ F4/80+) are shown. TBI macrophages were sorted to high purity and processed for single-cell RNA sequencing. b Transcriptomes of 45 individual TBI brain macrophages were analyzed for cell lineage marker expression. Each diamond symbol in the stacked dot plot represents a single TBI macrophage. For each cell, gene expression of markers of neurons, astrocytes, microglia, monocytes, dendritic cells, NK cells, T and B cells, and neutrophils (N) is shown as transcripts per million (TPM). The percentage of TBI brain macrophages positively expressing a gene (TPM > 0.1) is reported above each column
Fig. 2
Fig. 2
TBI brain macrophages express several signature genes of M(IL4), M(IL10), and M(LPS, IFNγ) macrophage classes. Gene expression of 74 macrophage polarization genes representing distinct macrophage classes of M(IL4), M(LPS, IFNγ), M(IL10), and M(IC) were analyzed in individual TBI macrophages by single-cell RNA sequencing. Each diamond symbol in the stacked dot plot represents a single TBI macrophage, 45 individual cells were analyzed. The percentage of TBI brain macrophages positively expressing a gene (TPM > 0.1) is reported above each gene column
Fig. 3
Fig. 3
PCA of macrophage polarization gene expression is compared to PCA of randomized genes. PCA of 74 markers of macrophage polarization (left) and PCA of the same expression data in randomized order (right) are shown for comparison
Fig. 4
Fig. 4
Co-expression analysis of macrophage polarization markers demonstrate incoherent expression in TBI macrophages. a Pairwise dot plots of absolute expression values of widely accepted signature macrophage polarization markers in TBI macrophages are shown. Co-expression analyses of signature genes within the same group were analyzed by linear regression analysis, and Pearson’s correlation coefficients (r 2) and the lines of best fit are presented. b Pairwise dot plot of absolute expression values of signature macrophage polarization markers across classes were analyzed in TBI macrophages. Results of linear regression analysis and r 2 are shown. c Signature macrophage polarization markers were analyzed for their capacity to predict gene expression of other signature macrophage polarization markers and shown here in stacked dot plots. The capacity of Mrc1 (TPM > 1) or lack of Mrc1 (TPM = 0.01) in a TBI macrophage to predict the mean expression level of Il1b or Tnf was statistically analyzed by Mann-Whitney U tests. All p values were insignificant (p < 0.05). Similarly, the expression of or lack of expression of Socs2 in a TBI macrophage failed to predict the mean expression level of Tnf, Arg1, and Chi3l3
Fig. 5
Fig. 5
Signature polarization genes are upregulated in brain macrophages post-TBI. a RNA flow cytometry was performed on bone marrow-derived macrophages (BMDM) that were gated for surface Itgam (CD11b) expression and intracellular Actb RNA expression. The latter is a gate for permeabilized cells. b RNA flow cytometry was performed on unstimulated (gray), LPS-polarized (red), and IL4-polarized (blue) BMDM. Probes for RNA expression of M(LPS, IFNγ) markers, Tnf and Il1b, and M(IL4) markers, Arg1 and Mrc1 were used to stain permeabilized BMDM and analyzed by flow cytometry. N = 3 independent experiments. c Ipsilateral hemisphere brain leukocytes were harvested from mice 1 day after TBI or sham surgery. Flow cytometry plots represent the gates used for live macrophages. d Macrophages harvested from ipsilateral brain hemispheres of mice 1 day after TBI (left, n = 6 independent experiments) and sham surgery (right, n = 3 independent experiments) were assessed by RNA flow cytometry. Analysis markers were drawn based on non-specific background staining using DapB RNA probes for a bacterial gene. The percentage of positive expression shown is the difference in the percent of brain macrophages expressing the M1 or M2 gene and the percent of cells with background detection of DapB RNA
Fig. 6
Fig. 6
RNA flow cytometry validates that TBI macrophages co-express macrophage polarization markers across classes in unusual combinations. RNA flow cytometry for M(LPS, IFNγ) markers, Tnf and Il1b, were analyzed for their co-expression with M(IL4) markers, Arg1, Mrc1, and Chi3l3, in ipsilateral TBI brain hemispheres 1 day post-TBI. Quadrant gates were drawn based on DapB RNA probe binding. N = 3 independent experiments, with pooled tissues of eight age-matched cage mate mice for each experiment

References

    1. Corps KN, Roth TL, McGavern DB. Inflammation and neuroprotection in traumatic brain injury. JAMA Neurol. 2015;72(3):355–62. doi: 10.1001/jamaneurol.2014.3558. - DOI - PMC - PubMed
    1. Lozano D, Gonzales-Portillo GS, Acosta S, de la Pena I, Tajiri N, Kaneko Y, Borlongan CV. Neuroinflammatory responses to traumatic brain injury: etiology, clinical consequences, and therapeutic opportunities. Neuropsychiatr Dis Treat. 2015;11:97–106. - PMC - PubMed
    1. Hinson HE, Rowell S, Schreiber M. Clinical evidence of inflammation driving secondary brain injury: a systematic review. J Trauma Acute Care Surg. 2015;78:184–191. doi: 10.1097/TA.0000000000000468. - DOI - PMC - PubMed
    1. Kumar A, Alvarez-Croda DM, Stoica BA, Faden AI, Loane DJ. Microglial/macrophage polarization dynamics following traumatic brain injury. J Neurotrauma 2015. [Epub ahead of print] - PMC - PubMed
    1. Gyoneva S, Ransohoff RM. Inflammatory reaction after traumatic brain injury: therapeutic potential of targeting cell-cell communication by chemokines. Trends Pharmacol Sci. 2015;36:471–480. doi: 10.1016/j.tips.2015.04.003. - DOI - PMC - PubMed

Publication types

MeSH terms