. 2016 Jul:337:1-11.
doi: 10.1016/j.heares.2016.05.007. Epub 2016 May 21.

Cochlear perfusion with a viscous fluid

Affiliations

Cochlear perfusion with a viscous fluid

Yi Wang et al. Hear Res. 2016 Jul.

Abstract

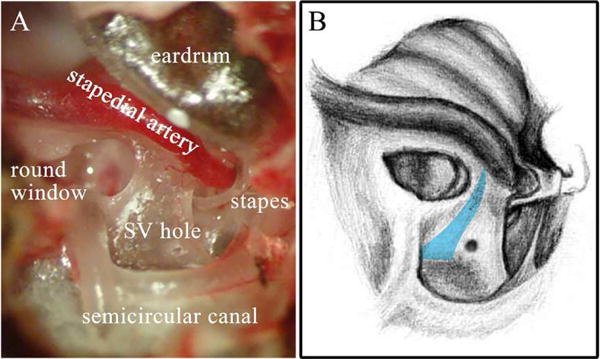
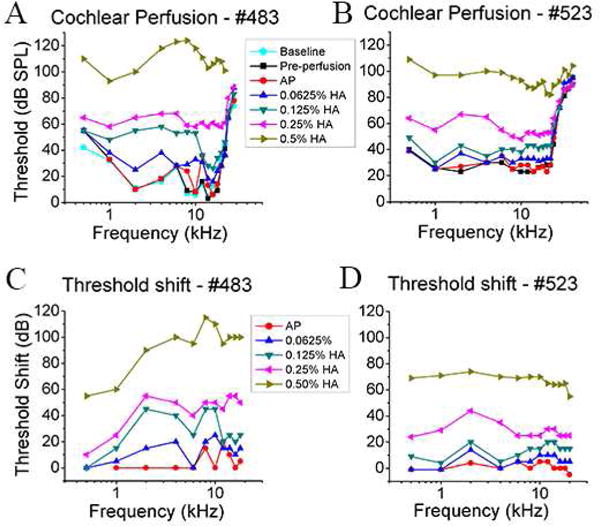
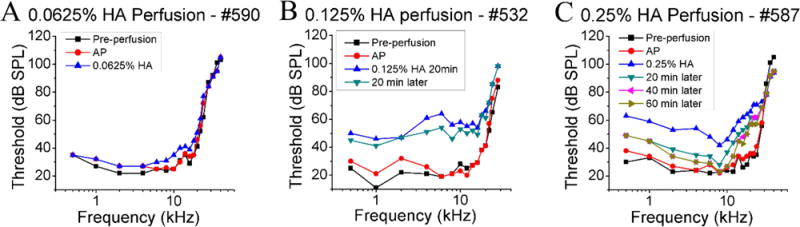
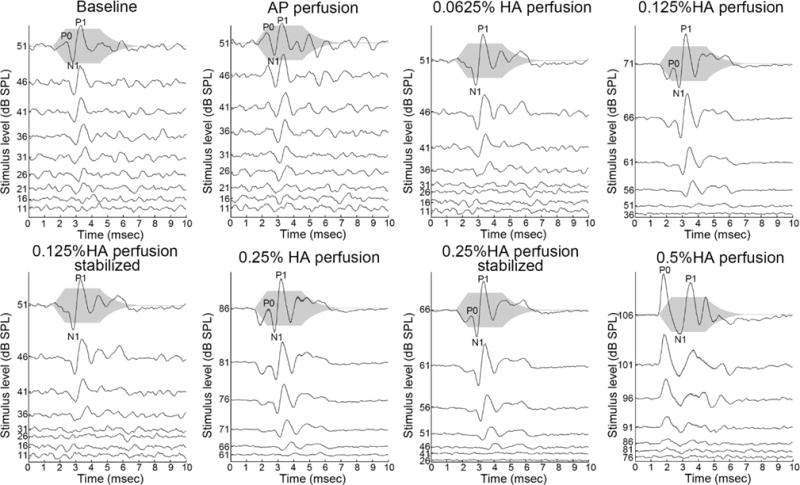
The flow of viscous fluid in the cochlea induces shear forces, which could provide benefit in clinical practice, for example to guide cochlear implant insertion or produce static pressure to the cochlear partition or wall. From a research standpoint, studying the effects of a viscous fluid in the cochlea provides data for better understanding cochlear fluid mechanics. However, cochlear perfusion with a viscous fluid may damage the cochlea. In this work we studied the physiological and anatomical effects of perfusing the cochlea with a viscous fluid. Gerbil cochleae were perfused at a rate of 2.4 μL/min with artificial perilymph (AP) and sodium hyaluronate (Healon, HA) in four different concentrations (0.0625%, 0.125%, 0.25%, 0.5%). The different HA concentrations were applied either sequentially in the same cochlea or individually in different cochleae. The perfusion fluid entered from the round window and was withdrawn from basal scala vestibuli, in order to perfuse the entire perilymphatic space. Compound action potentials (CAP) were measured after each perfusion. After perfusion with increasing concentrations of HA in the order of increasing viscosity, the CAP thresholds generally increased. The threshold elevation after AP and 0.0625% HA perfusion was small or almost zero, and the 0.125% HA was a borderline case, while the higher concentrations significantly elevated CAP thresholds. Histology of the cochleae perfused with the 0.0625% HA showed an intact Reissner's membrane (RM), while in cochleae perfused with 0.125% and 0.25% HA RM was torn. Thus, the CAP threshold elevation was likely due to the broken RM, likely caused by the shear stress produced by the flow of the viscous fluid. Our results and analysis indicate that the cochlea can sustain, without a significant CAP threshold shift, up to a 1.5 Pa shear stress. Beside these finding, in the 0.125% and 0.25% HA perfusion cases, a temporary CAP threshold shift was observed, perhaps due to the presence and then clearance of viscous fluid within the cochlea, or to a temporary position shift of the Organ of Corti. After 0.5% HA perfusion, a short latency positive peak (P0) appeared in the CAP waveform. This P0 might be due to a change in the cochlea's traveling-wave pattern, or distortion in the cochlear microphonic.

Keywords: Cochlear implantation; Cochlear mechanics; Cochlear perfusion; Compound action potential; Sodium hyaluronate; Viscous fluid.


Figures

Fig.1
Fig.1. View of the gerbil cochlea from the bulla opening
The cochleostomy can be seen in the SV, and the RWM was torn so the perfusion fluid could enter the cochlea. A: Experimental photo with cochlea structure labeled. Apex of the cochlea was covered by eardrum, thus is not visible here. B: Corresponding sketch, with eardrum removed. The wall of the SM is represented in blue. Drawing by Vanessa Cervantes.
Fig.2
Fig.2. Diagram of perfusion system
A: Set up of the perfusion system. The gray color indicates the fluid space, and the arrow indicates the flow direction. Perfusion fluid was supplied to the ST space at the open RW with a soft syringe, and pulled out from basal SV hole by a perfusion pump in withdraw mode. The SV hole and perfusion pump were connected by a perfusion cannula (illustrated in detail at B), with one side inserted into the SV hole and the other side connected to the perfusion pump. The gap between the tip of the perfusion cannula and the SV hole was sealed by dental cement to create a leak-free perfusion system. B: Detailed diagram of perfusion cannula. The tip that was inserted into SV (left side in the figure) was composed of a polyimide-coated glass tubing and a capillary. A length of tubing connected the tip to the syringe pump. The different parts of the perfusion cannula were glued together with silicone rubber.
Fig.3
Fig.3. CAP threshold change after cochlear perfusion with different fluids
Data from gerbil # 483 are shown in A and C and the data from gerbil # 523 are shown in B and D. AP, 0.0625% HA, 0.125% HA, 0.25% HA, and 0.5% HA were perfused sequentially at the rate of 2.4 μL/min, in the order of increasing viscosity. Baseline thresholds were measured just after the bulla was opened. Pre-perfusion thresholds were measured after the cochleostomy was made and the perfusion cannula was cemented to the cochlea. A, B: CAP threshold curves after cochlear perfusion; C, D: Corresponding CAP threshold shift compared with pre-perfusion. 0.5–20 kHz stimulus range is shown. For 0.125% and 0.25% HA perfusion, several CAP threshold measurements were made after perfusion and the stabilized thresholds are shown.
Fig.4
Fig.4. CAP threshold stabilization after cochlear perfusion with viscous fluid
Data are from the same animals as in Fig.3, A, C for #483, and B, D for #523. A, B: CAP thresholds after 0.125% HA perfusion, measured at the time just after perfusion (0 min), and ~ 20 and ~ 40 min later. C, D: CAP thresholds after 0.25% HA perfusion, measured at the time just after perfusion (0 min), and ~ 20, ~ 40 and ~ 60 min later.
Fig.5
Fig.5. CAP threshold change after cochlear perfusion with 0.0625%, 0.125% and 0.25% HA
CAP threshold curves from three animals perfused separately with A: 0.0625% HA, B: 0.125% HA and C: 0.25% HA are shown. Each cochlea was perfused first with AP, followed by HA. Thresholds after 0.125% and 0.25% HA perfusion were measured several times to observe the threshold stabilization.
Fig.6
Fig.6. Example of CAP waveform change in response to a 4 kHz stimulus (animal: #523)
The gray shadow indicates the stimulus envelope. (The magnitude of the envelope does not reflect the stimulus level.) The dashed lines in conditions of “baseline” and “after 0.5% HA perfusion” indicate the first peak latency at the largest stimulus level. After 0.5% HA perfusion, substantial waveform changes occurred; in particular the CAP response began with a large, short latency P0 instead of N1. The CAP response waveform partially recovered over time after the 0.125% HA and 0.25% HA perfusions. The rippled response that appeared first after the 0.125% perfusion at high stimulus levels is at 8 kHz (second harmonic of 4kHz), and this and the DC offset of the response are likely due to increased nonlinear distortion in CM.
Fig.7
Fig.7. Example of CAP waveform changes in response to an 8 kHz stimulus (animal: #523)
The gray shadow indicates the stimulus envelope. After 0.5% HA perfusion, the CAP response was distorted and started with a large, short-latency P0. A small P0 appeared at high stimulus levels even in the baseline condition. CM second harmonic is not apparent but could be present, as it would have been substantially attenuated by the CAP amplifier filter.
Fig.8
Fig.8. CAP thresholds of HA cochlear perfusion followed by AP perfusion
The CAP thresholds were measured pre-perfusion, just after 0.125% HA perfusion, 20 min later, and just after AP perfusion. The thresholds improved 20 min after HA perfusion, and did not recover further after AP perfusion.
Fig.9
Fig.9. Histological photo for perfused and control cochlea
Corresponding physiological data was in Fig.5. A: 0.0625% HA perfused cochlea. RM was intact. B: 0.125% HA perfused cochlea. RM was partly torn (circled in red). C: 0.25% HA perfused cochlea. RM was partly torn (circled in red). D: Control. The RM was intact. Some parts of the OC were distorted because of the histological processing.

References

    1. Antoli-Candela F, Kiang NYS. Evoked Electrical Activity in the Auditory Nervous System. Academic Press; New York: 1978. Unit activity underlying the N1 potential; pp. 165–191.
    1. Dong W, Olson ES. Detection of cochlear amplification and its activation. Biophysical journal. 2013;105:1067–1078. doi: 10.1016/j.bpj.2013.06.049. - DOI - PMC - PubMed
    1. Edge RM, Evans BN, Pearce M, Richter CP, Hu X, Dallos P. Morphology of the unfixed cochlea. Hearing Research. 1998;124:1–16. doi: 10.1016/S0378-5955(98)00090-2. - DOI - PubMed
    1. Fitzgerald JJ, Robertson D, Johnstone BM. Effects of intra-cochlear perfusion of salicylates on cochlear microphonic and other auditory responses in the guinea pig. Hearing research. 1993;67:147–156. doi: 10.1016/0378-5955(93)90242-S. - DOI - PubMed
    1. Flock Å, Flock B. Hydrops in the cochlea can be induced by sound as well as by static pressure. Hearing Research. 2000;150:175–188. doi: 10.1016/S0378-5955(00)00198-2. - DOI - PubMed

Publication types

Substances