

Towards monitoring dysplastic progression in the oral cavity using a hybrid fiber-bundle imaging and spectroscopy probe
- PMID: 27220821
- PMCID: PMC4879668
- DOI: 10.1038/srep26734
Towards monitoring dysplastic progression in the oral cavity using a hybrid fiber-bundle imaging and spectroscopy probe
Abstract
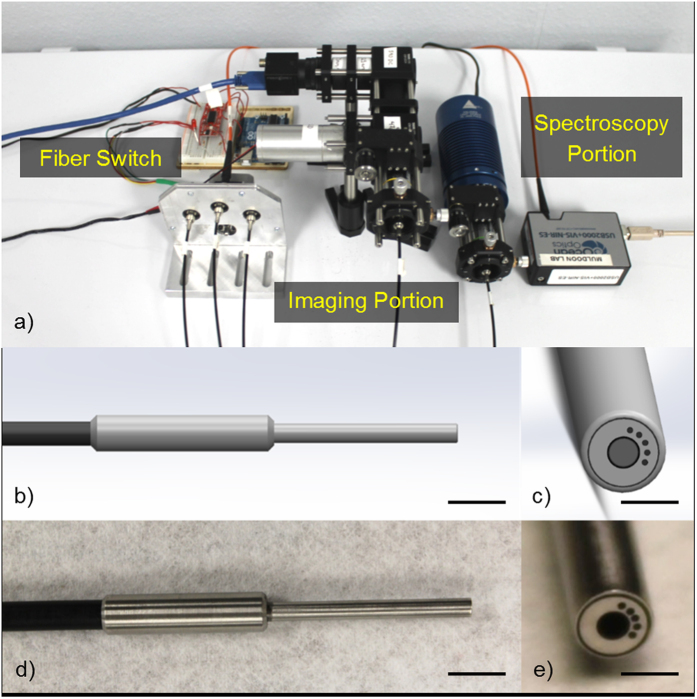
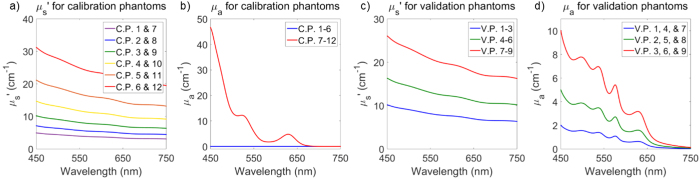
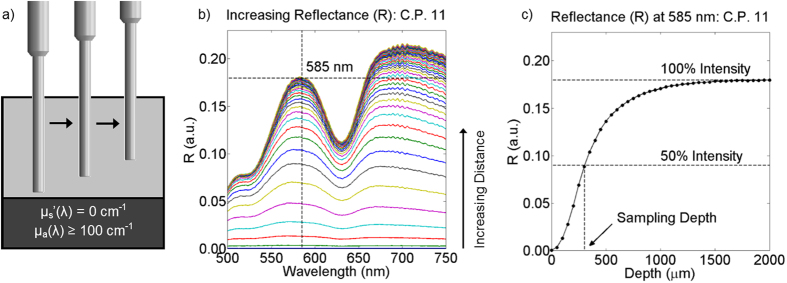
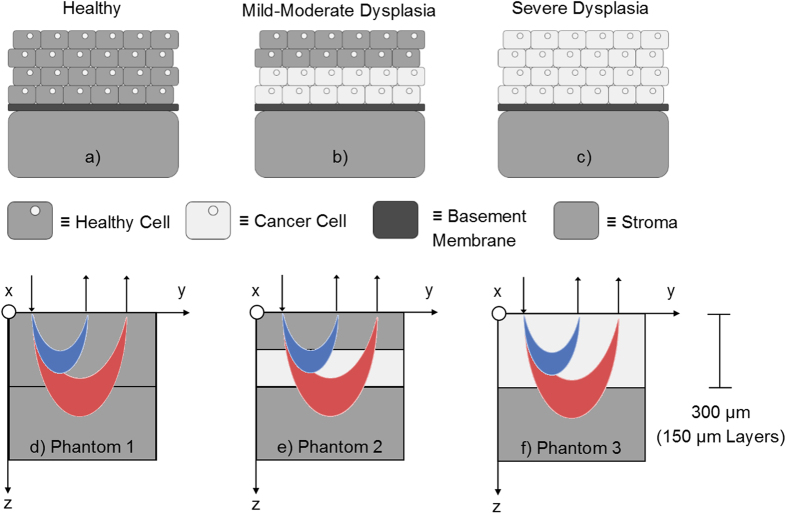
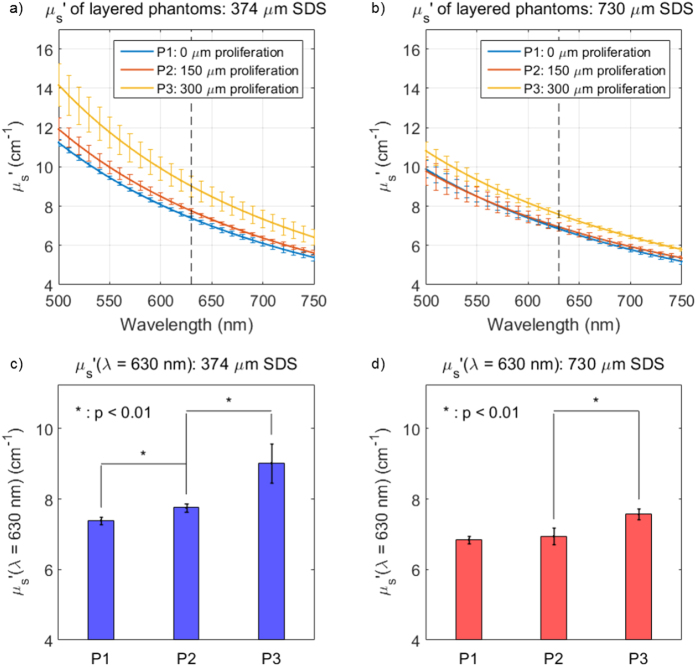
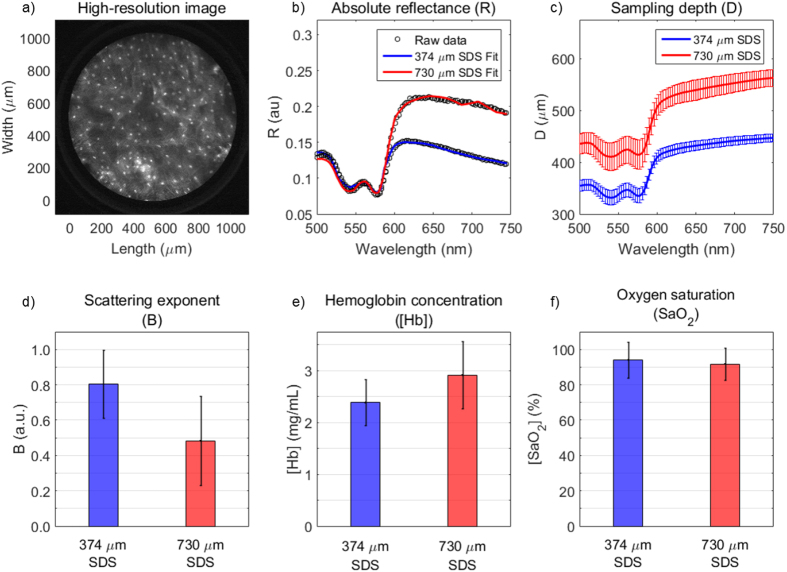
Intraepithelial dysplasia of the oral mucosa typically originates in the proliferative cell layer at the basement membrane and extends to the upper epithelial layers as the disease progresses. Detection of malignancies typically occurs upon visual inspection by non-specialists at a late-stage. In this manuscript, we validate a quantitative hybrid imaging and spectroscopy microendoscope to monitor dysplastic progression within the oral cavity microenvironment in a phantom and pre-clinical study. We use an empirical model to quantify optical properties and sampling depth from sub-diffuse reflectance spectra (450-750 nm) at two source-detector separations (374 and 730 μm). Average errors in recovering reduced scattering (5-26 cm(-1)) and absorption coefficients (0-10 cm(-1)) in hemoglobin-based phantoms were approximately 2% and 6%, respectively. Next, a 300 μm-thick phantom tumor model was used to validate the probe's ability to monitor progression of a proliferating optical heterogeneity. Finally, the technique was demonstrated on 13 healthy volunteers and volume-averaged optical coefficients, scattering exponent, hemoglobin concentration, oxygen saturation, and sampling depth are presented alongside a high-resolution microendoscopy image of oral mucosa from one volunteer. This multimodal microendoscopy approach encompasses both structural and spectroscopic reporters of perfusion within the tissue microenvironment and can potentially be used to monitor tumor response to therapy.
Figures
Similar articles
-
In vivo measurement of non-keratinized squamous epithelium using a spectroscopic microendoscope with multiple source-detector separations.Proc SPIE Int Soc Opt Eng. 2016 Feb 13;9715:97150Z. doi: 10.1117/12.2211866. Epub 2016 Mar 4. Proc SPIE Int Soc Opt Eng. 2016. PMID: 27134337 Free PMC article.
-
Fiber-bundle microendoscopy with sub-diffuse reflectance spectroscopy and intensity mapping for multimodal optical biopsy of stratified epithelium.Biomed Opt Express. 2015 Nov 19;6(12):4934-50. doi: 10.1364/BOE.6.004934. eCollection 2015 Dec 1. Biomed Opt Express. 2015. PMID: 26713207 Free PMC article.
-
Sampling depth of a diffuse reflectance spectroscopy probe for in-vivo physiological quantification of murine subcutaneous tumor allografts.J Biomed Opt. 2018 Aug;23(8):1-14. doi: 10.1117/1.JBO.23.8.085006. J Biomed Opt. 2018. PMID: 30152204 Free PMC article.
-
Design and validation of a diffuse reflectance and spectroscopic microendoscope with poly(dimethylsioxane)-based phantoms.Proc SPIE Int Soc Opt Eng. 2015 Mar 9;9332:93320R. doi: 10.1117/12.2076300. Proc SPIE Int Soc Opt Eng. 2015. PMID: 25983372 Free PMC article.
-
A Dual-modality Smartphone Microendoscope for Quantifying the Physiological and Morphological Properties of Epithelial Tissues.Sci Rep. 2019 Oct 31;9(1):15713. doi: 10.1038/s41598-019-52327-x. Sci Rep. 2019. PMID: 31673087 Free PMC article.
Cited by
-
Intra-class variability in diffuse reflectance spectroscopy: application to porcine adipose tissue.Biomed Opt Express. 2018 Apr 20;9(5):2297-2303. doi: 10.1364/BOE.9.002297. eCollection 2018 May 1. Biomed Opt Express. 2018. PMID: 29760988 Free PMC article.
-
Diffuse Reflectance Spectroscopy of the Oral Mucosa: In Vivo Experimental Validation of the Precancerous Lesions Early Detection Possibility.Diagnostics (Basel). 2023 May 5;13(9):1633. doi: 10.3390/diagnostics13091633. Diagnostics (Basel). 2023. PMID: 37175023 Free PMC article.
-
Spatially resolved diffuse reflectance spectroscopy endoscopic sensing with custom Si photodetectors.Biomed Opt Express. 2018 Feb 15;9(3):1164-1176. doi: 10.1364/BOE.9.001164. eCollection 2018 Mar 1. Biomed Opt Express. 2018. PMID: 29541510 Free PMC article.
-
Macrophage-targeted anti-CCL2 immunotherapy enhances tumor sensitivity to 5-fluorouracil in a Balb/c-CT26 murine colon carcinoma model measured using diffuse reflectance spectroscopy.BMC Immunol. 2022 Apr 23;23(1):20. doi: 10.1186/s12865-022-00493-5. BMC Immunol. 2022. PMID: 35461243 Free PMC article.
-
Label-Free Optical Spectroscopy for Early Detection of Oral Cancer.Diagnostics (Basel). 2022 Nov 22;12(12):2896. doi: 10.3390/diagnostics12122896. Diagnostics (Basel). 2022. PMID: 36552903 Free PMC article. Review.
References
-
- Bouquot J. E., Speight P. M. & Farthing P. M. Epithelial dysplasia of the oral mucosa—Diagnosticproblems and prognostic features. Current Diagnostic Pathology 12, 11–21 (2006).
Publication types
MeSH terms
Grants and funding
LinkOut - more resources
Full Text Sources
Other Literature Sources
