

Higher-order oligomerization promotes localization of SPOP to liquid nuclear speckles
- PMID: 27220849
- PMCID: PMC4910529
- DOI: 10.15252/embj.201593169
Higher-order oligomerization promotes localization of SPOP to liquid nuclear speckles
Abstract
Membrane-less organelles in cells are large, dynamic protein/protein or protein/RNA assemblies that have been reported in some cases to have liquid droplet properties. However, the molecular interactions underlying the recruitment of components are not well understood. Herein, we study how the ability to form higher-order assemblies influences the recruitment of the speckle-type POZ protein (SPOP) to nuclear speckles. SPOP, a cullin-3-RING ubiquitin ligase (CRL3) substrate adaptor, self-associates into higher-order oligomers; that is, the number of monomers in an oligomer is broadly distributed and can be large. While wild-type SPOP localizes to liquid nuclear speckles, self-association-deficient SPOP mutants have a diffuse distribution in the nucleus. SPOP oligomerizes through its BTB and BACK domains. We show that BTB-mediated SPOP dimers form linear oligomers via BACK domain dimerization, and we determine the concentration-dependent populations of the resulting oligomeric species. Higher-order oligomerization of SPOP stimulates CRL3(SPOP) ubiquitination efficiency for its physiological substrate Gli3, suggesting that nuclear speckles are hotspots of ubiquitination. Dynamic, higher-order protein self-association may be a general mechanism to concentrate functional components in membrane-less cellular bodies.
Keywords: isodesmic self‐association; membrane‐less organelle; prostate cancer; speckle‐type POZ protein; ubiquitin ligase.
© 2016 The Authors. Published under the terms of the CC BY NC ND 4.0 license.
Figures
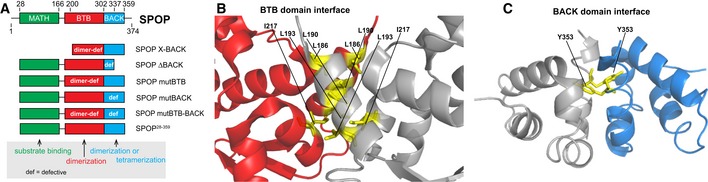
Cartoon schematic of the
SPOP self‐association‐incompetent mutant constructs that form complexes through only one (or neither) of the self‐association domains is shown. The previously described mutation Y353E (van Geersdaele et al, 2013) was introduced into theBACK domain so that self‐association could only occur throughBTB ‐mediated interactions resulting inSPOP mutBACK ; previously described mutations of the conservedBTB interface (Zhuang et al, 2009) resulted inSPOP mutBTB , which self‐associates only throughBACK ‐mediated interactions. Constructs for expression in mammalian cells encode the full‐length protein; those for expression in bacteria comprise residues 28–359.Ribbon diagram of
SPOP ΔBACK [PDB ID 3HQI (Zhuang et al, 2009)] showing residues that are mutated to abolishBTB domain self‐association (L186D, L190D, L193D, I217K). The domains are colored as in (A) (MATH , green;BTB , red; andBACK , blue), with one monomer shown in gray for clarity. Introduction of these mutations does not abolish the interaction betweenSPOP and theCRL because they are not part of theSPOP /cullin‐3 interface (Errington et al, 2012; Zhuang et al, 2009) and because mutation of theBTB domain or deletion of theBACK domain does not preventSPOP from promoting ubiquitination of substrates (Zhuang et al, 2009; Errington et al, 2012).Ribbon diagram of
SPOP 270–374 (L273D L282D L285K) dimer crystal structure [PDB ID 4HS 2 (van Geersdaele et al, 2013)] showing residue Y353, which is mutated to E to preventBACK domain self‐association. The domains are colored as in (A) (MATH , green;BTB , red; andBACK , blue), with one monomer shown in gray for clarity.
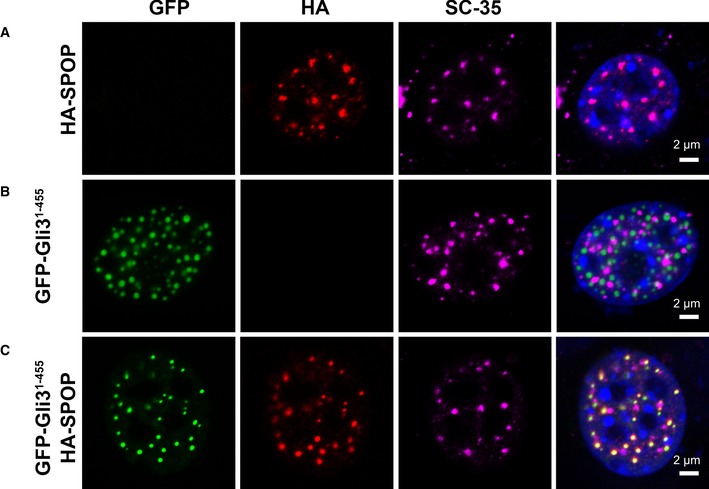
- A–C
Confocal microscopy images of fixed
NIH 3T3 cells transiently expressing (A) full‐lengthHA ‐SPOP , (B)GFP ‐Gli31–455, and (C)HA ‐SPOP +GFP ‐Gli31–455 are shown.DAPI was used to stain the nucleus,SPOP localization was identified using an anti‐HA antibody, nuclear speckle localization was identified using an anti‐SC ‐35 antibody, and Gli31–455 localization was identified viaGFP fluorescence.SPOP co‐localizes with a marker for nuclear speckles or with the substrate Gli31–455. The areas with overlappingHA andGFP signal contain 75% of the punctateHA signal and 100% of the punctateGFP signal. For expression levels ofHA ‐SPOP andGFP ‐Gli31–455 proteins, see Appendix Fig S3. Transfection efficiencies of pcDNA ‐GFP ‐Gli31–455 and pcDNA ‐HA ‐SPOP are 20–25% and 6–10%, respectively. When both constructs are used, ˜70–80% of transfected cells express both constructs (see Appendix Tables S1, S2 and S3).
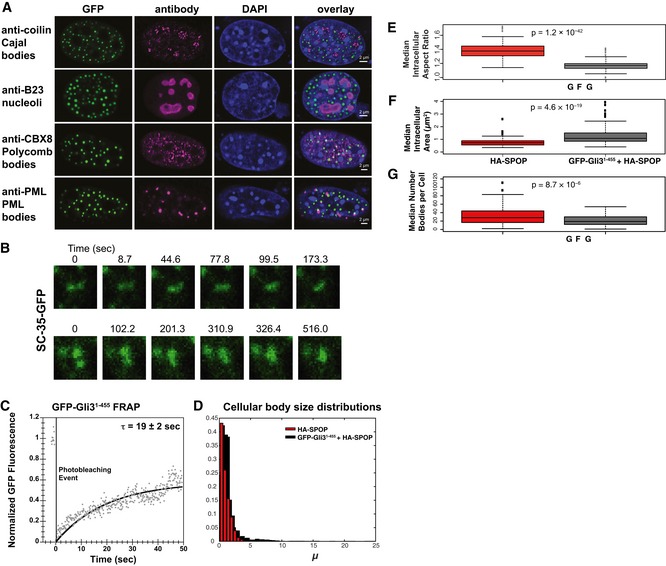
- A
Gli31–455‐positive bodies are not Cajal bodies, nucleoli, polycomb bodies, or
PML bodies.NIH 3T3 cells were transfected withGFP ‐Gli31–455 and stained with antibodies against coilin (a Cajal marker), B23 (a nucleolus marker),CBX 8 (a polycomb marker), orPML (aPML body marker). - B
NIH 3T3 cells were transfected with a construct expressingSC ‐35‐GFP andGFP fluorescence was monitored in live cells. Snapshots at indicated time points show a nuclear speckle fusion event. - C
NIH 3T3 cells were transfected with a construct expressingGFP ‐Gli31–455, andGFP fluorescence was monitored in live cells. Individual nuclear bodies were photobleached, andFRAP was monitored for 1 min. Data were normalized to the maximum and minimum intensity. The mean characteristic recovery time is indicated ±SEM . - D
Histograms depicting the size distribution of nuclear body areas are shown for cells transfected with
HA ‐SPOP alone andGFP ‐Gli31–455 +HA ‐SPOP . - E–G
NIH 3T3 cells were transfected with onlyHA ‐SPOP orGFP ‐Gli31–455 +HA ‐SPOP . Box plots of the median aspect ratio of the (E)GFP ‐Gli31–455‐positive nuclear bodies in one cell, (F) of the intracellular median area of nuclear speckles, and (G) of the number of bodies per cell for cells transfected withHA ‐SPOP alone andGFP ‐Gli31–455 +HA ‐SPOP are shown. All three were significantly different (P = 1.2 × 10−42, P = 4.6 × 10⁻¹⁹, and P = 8.7 × 10⁻⁶, respectively, according to the Wilcoxon rank‐sum test), consistent with the different nature of distinct nuclear bodies. The medians are indicated as black horizontal lines within the boxes, and boxes enclose values between the first and third quartile. Interquartile range (IQR ) is calculated by subtracting the first quartile from the third quartile. All values that lay more than 1.5×IQR lower than the first quartile or 1.5× higher than the third quartile are outliers that are plotted as squares. The smallest and highest values that are not outliers are connected with the dashed line.
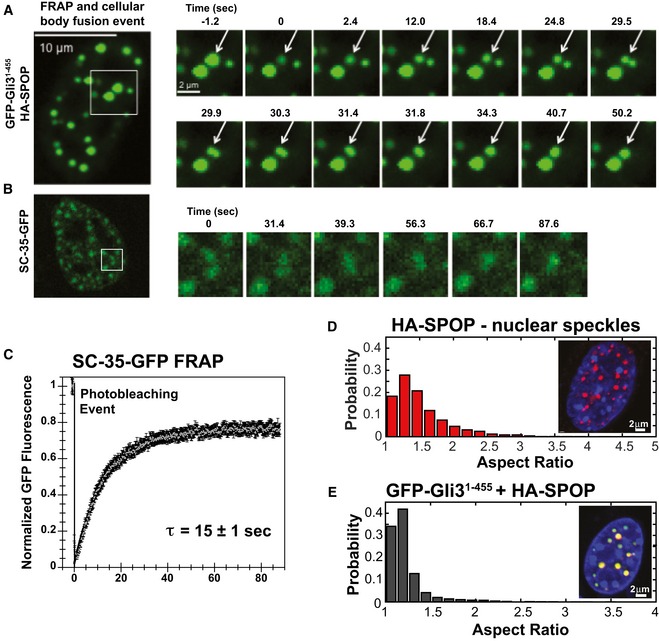
- A, B
NIH 3T3 cells were (A) co‐transfected with constructs expressing full‐lengthSPOP andGFP ‐Gli31–455 or (B) transfected with a construct expressingSC ‐35‐GFP , andGFP fluorescence was monitored in live cells. (A) Snapshots were taken from individual time points as noted in the figure to show photobleaching (at 0 s), recovery, and nuclear body fusion events. The arrow in each panel points to the body that was photobleached and subsequently fuses with another body. These data were not used to calculate the average recovery time as the fusion event precludes accurate measurement of fluorescence recovery. (B) Snapshots at the indicated time points show a nuclear speckle fusion event. Additional images are shown in Fig EV1. - C
Individual nuclear speckles were photobleached and
FRAP was monitored for 90 s. Data from 45 individual cells andFRAP events were corrected for background, normalized to the minimum and maximum intensity, and the mean is shown with error bars representing the standard error of the mean. The mean characteristic recovery time is indicated ±SEM . - D, E
Nuclear bodies are close to spherical. (D) Aspect ratios for speckles observed in
NIH 3T3 cells transfected with constructs expressingHA ‐SPOP (151 cells) (D), orGFP ‐Gli31–455 andHA ‐SPOP (155 cells) (E) were calculated as described previously (Brangwynne et al, 2011). Representative individual images of cells are shown as insets in each panel.
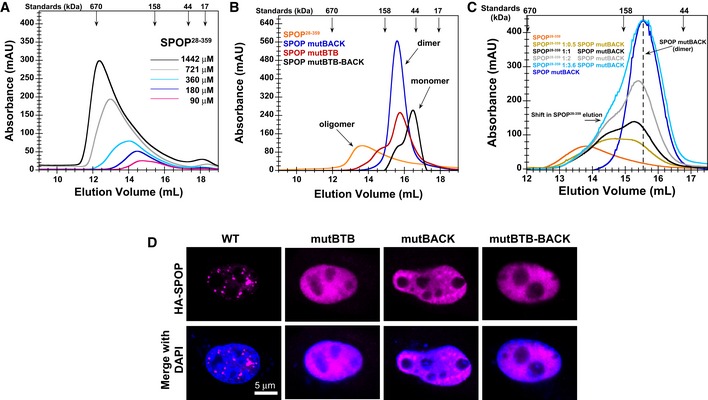
SEC chromatograms of given loading concentrations ofSPOP 28–359 are shown. The concentrations were normalized to the monomer molecular weight, that is, identical concentrations of dimericSPOP ΔBACK (see Fig EV2) and oligomericSPOP 28–359 contain identical numbers of protomers.SEC chromatograms forSPOP constructs defective in self‐association in one or both oligomerization domains are shown. Proteins were injected at the same loading concentration (533 μM), and the elution volume of globular molecular weight standards is noted above the graph.SEC chromatograms ofSPOP 28–359 (200 μM),SPOP mutBACK (718 μM), and mixtures of the two (ratios given in the figure,SPOP at 200 μM) are shown. The elution volume of globular molecular weight standards is noted above the graph.Constructs for expressing full‐length
HA ‐SPOP orHA ‐SPOP mutants capable of oligomerization through only one (or neither) of the self‐association domains were transfected intoNIH 3T3 cells.DAPI was used to stain the nucleus, andSPOP localization was identified using an anti‐HA antibody. Experiments were performed at least twice on four biological samples. Multiple cells were examined, and representative cells are shown. For additional images, see Appendix Fig S4.
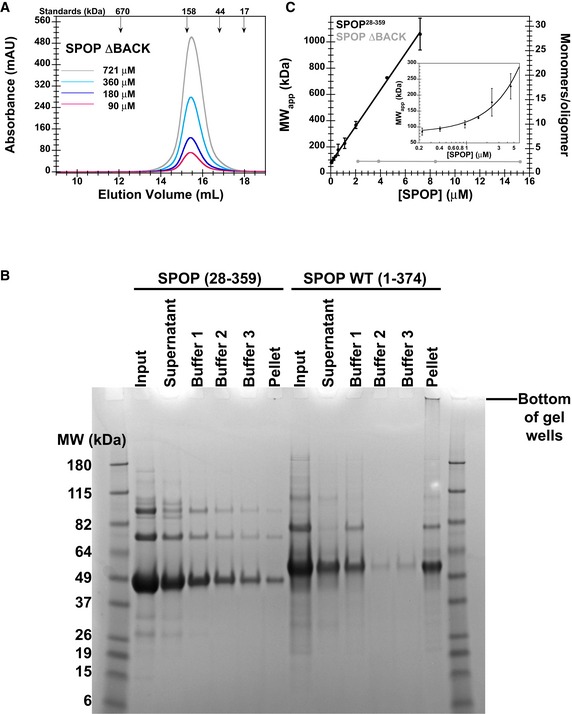
SEC chromatograms of given loading concentrations ofSPOP ΔBACK are shown. The concentrations were normalized to the monomer molecular weight, that is, identical concentrations of dimericSPOP ΔBACK and oligomericSPOP 28–359 contain identical numbers of protomers.Protein aggregation was assayed by centrifuging protein samples, resuspending soluble pelleted material in buffer three times, and then resuspending the final insoluble pellet in sample loading dye. The ultracentrifugation conditions are expected to pellet some of the larger
SPOP 28–359 oligomeric species. These species are readily soluble in fresh buffer and do not represent aggregated material. In contrast, the majority ofSPOP FL forms insoluble aggregates that do not dissociate even under extensive dilution, but can be resolubilized in denaturing gel sample buffer. These results show at least very slow off‐rates ofSPOP from the aggregates, not only high stability of the aggregates, and are therefore strongly indicative of poor reversibility of aggregation.SPOP 28–359 oligomers have no apparent size limit. The apparent molecular weights (calculated from globular standards) of the major eluting species for each injection in Fig 4A and panel (A) are plotted against their elution concentrations and fit to a line. The number of monomers per oligomer was calculated by dividing the apparent molecular weight by the monomer mass and assumes regular packing of the monomer in the oligomer. The average and standard deviation of two independent experiments are shown forSPOP 28–359. Inset shows the same data in a semi‐logarithmic plot to highlight the lower concentrations ofSPOP 28–359 assayed.
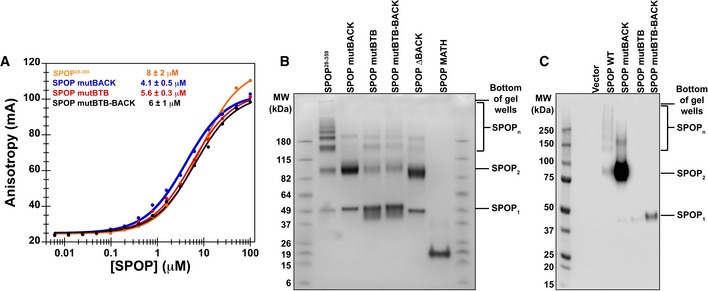
Substrate binding was assayed by anisotropy using a fluorescently labeled substrate peptide. All
SPOP variants bound substrate with an affinity similar to that ofSPOP 28–359 (4–8 μM, see Table 2). Experimental data are shown as circles; the solid lines are fits to equation (2) (Roehrl et al, 2004).In vitro cross‐linking assays were performed for
SPOP 28–359 and each mutant at 30 μM protein with the amide‐specificBS 3 cross‐linker. Cross‐linking forSPOP ΔBACK andMATH domain are shown to demonstrate that cross‐linking conditions do not lead to non‐specific cross‐linking of protein species.Cross‐linking reactions were performed on whole‐cell lysates from cells expressing wild‐type
SPOP ,SPOP mutBACK ,SPOP mutBTB , orSPOP mutBTB –BACK .SPOP 1,SPOP 2, andSPOP n identifySPOP monomers, dimers, and larger species, respectively. For loading levels, see Appendix Fig S5.
- A–C
The
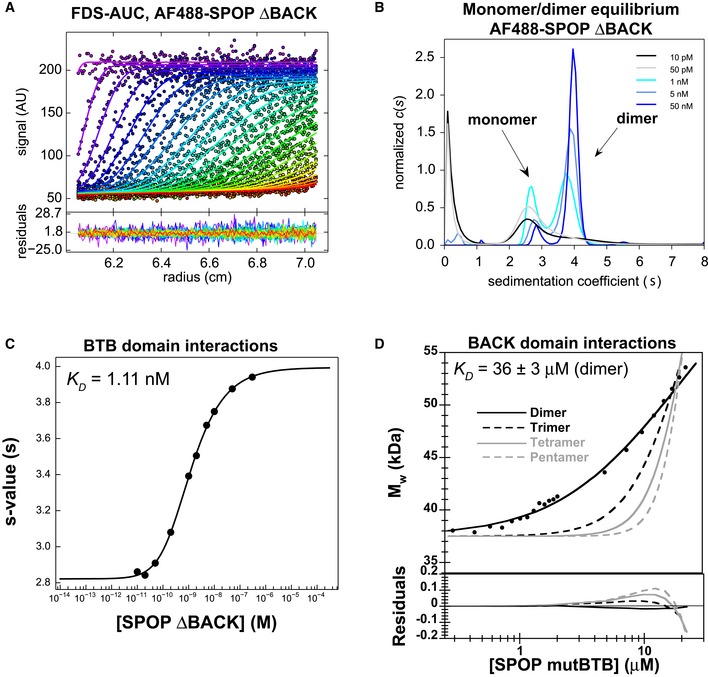
BTB domain dimerizes with nanomolar affinity. (A)SV ‐AUC data for 0.2nM AF 488‐SPOP ΔBACK . Fluorescence scans were collected for 12 h and are plotted against distance from the axis of rotation (circles). The data were subjected to standard c(s) analysis inSEDFIT (Schuck, 2000), and the results of this fit are shown (solid lines, rainbow color scheme). (B) Sedimentation coefficient distributions for a selection of values from the dilution series are shown. (C) The isotherm of weight‐average s‐values versus concentration (black circles) was fit to a dimer self‐association model and reveals aKD of 1.11 nM [95% confidence interval 0.88, 1.40 nM] (solid line). - D
The
BACK domain dimerizes with micromolar affinity. Experimental weight‐average molar mass (Mw) fromCG ‐MALS forSPOP mutBTB (black circles) was fitted to a self‐association model (see text for details) forBACK –BACK dimerization (black line) yielding aKD of 36 ± 3 μM (average and standard deviation from three independent experiments). Fits to the monomer/dimer equilibrium model and to alternative monomer–trimer, tetramer, and pentamer equilibrium models are depicted as black solid line and as dashed and gray lines, respectively. Residuals for all models are depicted in the lower panel.
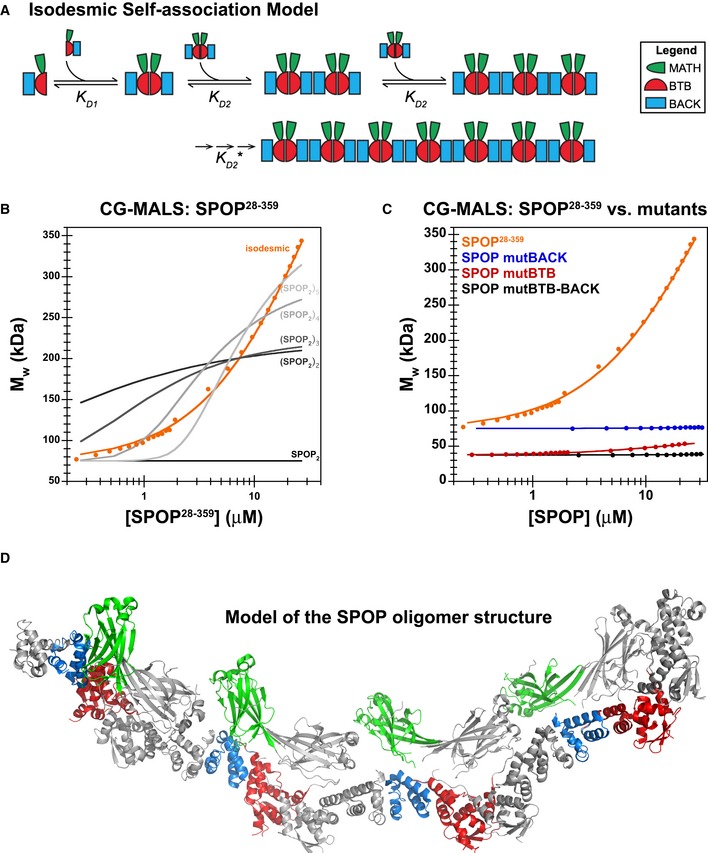
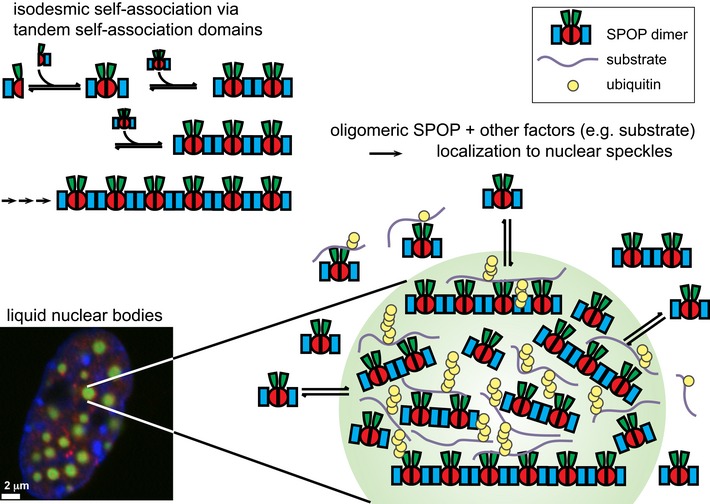
Cartoon schematic depicting the proposed isodesmic self‐association model.
KD 1 andKD 2 represent the domain‐mediated dimerization affinities for theBTB domain andBACK domains, respectively.KD 2 is identical for all association steps independent of oligomer size. At large oligomer sizes,KD 2 may increase due to entropic penalties, resulting inKD 2*. The N‐ and C‐termini contain neither defined domains nor low‐complexity sequences but may add additional self‐association behavior as evidenced by aggregation; these interactions were not dissected due to the poor reversibility of aggregation (Fig EV2B).Experimental weight‐average molar mass (Mw) from
CG ‐MALS forSPOP 28–359 (orange circles) was fitted to an isodesmic self‐association model in whichSPOP dimers are the self‐associating unit (orange line). The largestSPOP oligomer taken into account was an undecamer ofSPOP dimers [(SPOP 2)11]. The fits from three independent experiments yielded aKD 2 of 2.4 ± 0.4 μM. Lines for fits of the data to self‐association models that assume formation of individual oligomeric species instead of isodesmic self‐association are shown for reference (gray lines).Experimental weight‐average molar mass (Mw) from
CG ‐MALS data (circles) and fits (solid lines) are depicted for eachSPOP construct assayed, showing that a progressive increase inSPOP oligomer size is observed only when both self‐association domains are interaction‐competent. This figure is comprised of data shown in panel (B), Fig 6D and Appendix Fig S6A for direct comparison.Ribbon diagram illustrating structural model of an octamer
SPOP assembly. In a 27 μMSPOP solution, three percent of the oligomeric assemblies would be equal in size or larger. The domains are colored as in panel (A) and Fig 1 (MATH , green;BTB , red; andBACK , blue), with alternating monomers shown in gray for clarity. The model was built using two available crystal structures [PDB ID 3HQI (Zhuang et al, 2009) and 4HS 2 (van Geersdaele et al, 2013)], and no further assumptions.
- A
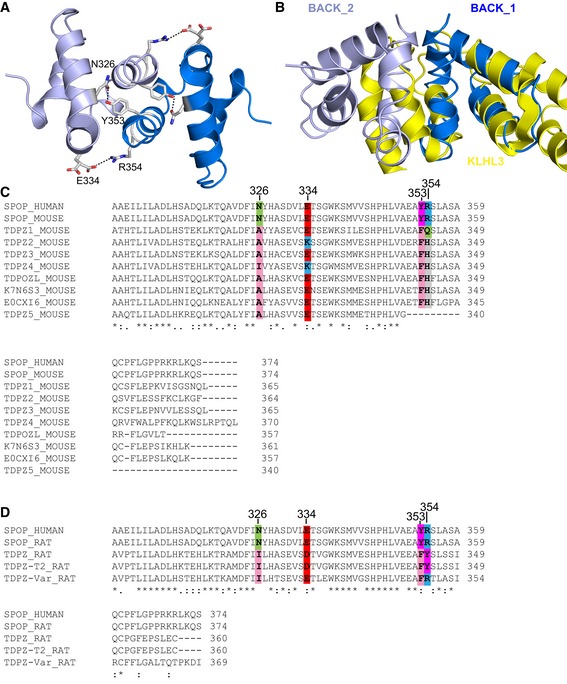
The
BACK domain dimer is stabilized via a hydrogen bond between N326 and Y353 and a salt bridge between E334 and R354. The twoBACK domain monomers are shown in different shades of blue. - B
The long form of the
BACK domain, as exemplified byKLHL 3 (shown in yellow,PDB ID 4HXI ), occludes the dimerization interface of the shortSPOP BACK domain. - C, D
The human genome contains only two genes encoding a protein with a
BTB and short version of theBACK domain,SPOP andSPOPL , the latter of which does not dimerize because of a sterically hindering insertion. The family ofBTB –BACK domain‐containing proteins is expanded in rodents. (C) Alignment of mouse protein sequences containing aBTB and a shortBACK domain with humanSPOP . The N326/Y353 and E334/R354 interactions are not conserved but could potentially be replaced by hydrophobic/aromatic and negatively charged/histidine interactions, respectively. (D) Alignment of rat protein sequences containing aBTB and a shortBACK domain with humanSPOP . In theTDPZ variant shown on the bottom, residues E334 and R354 are conserved, potentially enabling a salt bridge. This protein may undergo isodesmic self‐association into higher‐order oligomers.
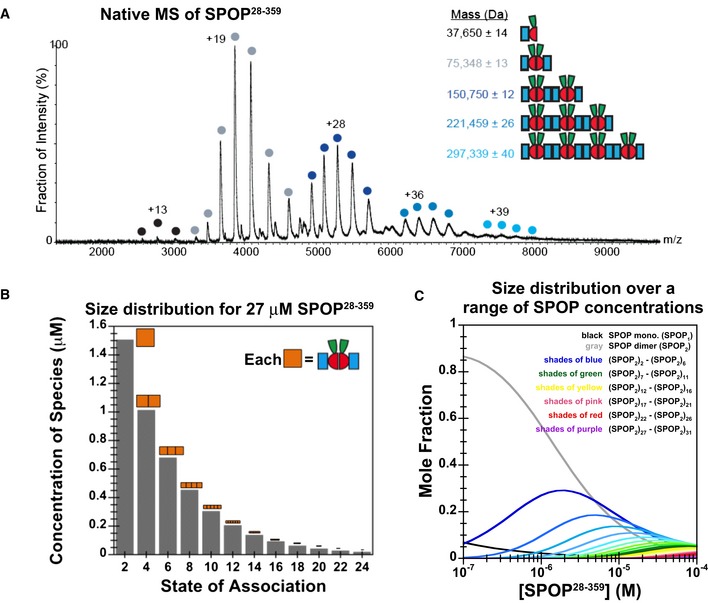
Native
MS spectrum of 30 μMSPOP 28–359 confirms thatSPOP self‐associates through addition of dimers. The increase in mass indicates that the dimer is the stable building block within the assemblies.Graphical representation of the
SPOP concentration of each oligomeric species within a 27 μMSPOP 28–359 sample. The cartoons' sizes are scaled based upon the fraction present within the total sample.Concentration dependence of the
SPOP oligomer size distribution (mole fraction) from isodesmic modeling ofCG ‐MALS data.
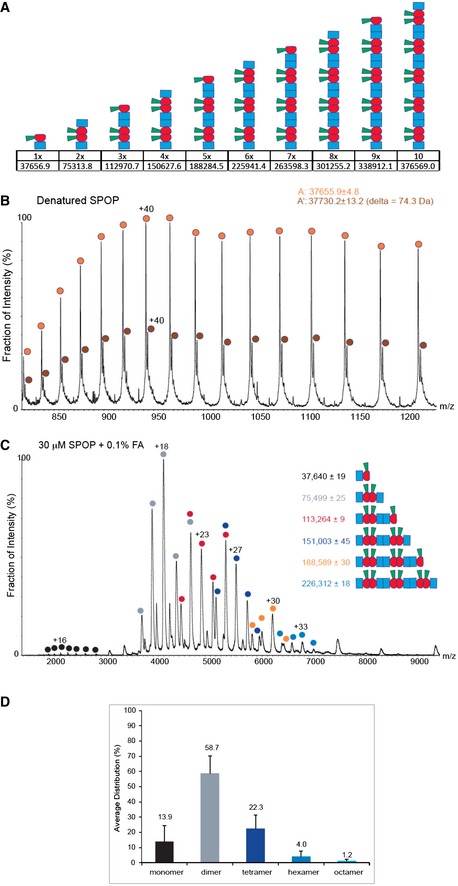
Schematic representation of putative
SPOP assemblies. Under each assembly state, the number of monomers and the theoretical mass are shown.Mass spectrum of denatured
SPOP . To evaluate the purity of the sample,SPOP (50 pmol) was loaded onto a monolithic column (Rozen et al, 2013) and eluted in a linear gradient of 20–50%ACN over 30 min. The protein eluted as a single peak at 17.6–19.8 min, at approximately 33%ACN . The spectrum shows a major population of 37,656 ± 5 Da (orange circles) and a smaller population of 37,730 ± 13 Da (brown circles). The mass difference may result from β‐mercaptoethanol.MS spectrum ofSPOP assemblies under partial denaturing conditions.SPOP was analyzed by performingMS after adding of 0.1% formic acid (30 μM) to disturb the non‐covalent interactions. Under these conditions, trimers (red circles) and pentamers (orange circles) were generated. The fact that odd numbers of assemblies appear only under mild denaturing conditions indicates strong interactions between two monomers.Size distribution of
SPOP oligomers at 30 μM protomer concentration from seven independent measurements.
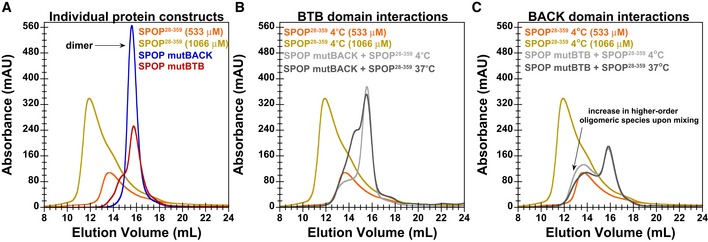
SEC chromatograms for individualSPOP constructs injected at a loading concentration of 533 μM (andSPOP 28–359 at 1,066 μM) are shown. In agreement withCG ‐MALS results,SPOP mutBTB andSPOP mutBACK predominantly form dimers (red and blue lines, respectively).SEC chromatogram for mixtures of 533 μMSPOP 28–359 with 533 μM ofSPOP mutBACK is shown. When equal amounts ofSPOP 28–359 and one of the mutants were mixed at 4°C, we observed thatSPOP mutBACK , which cannot participate in typicalBACK –BACK interactions, did not increase the population of higher‐order oligomers relative to that ofWT only, as evidenced by a similar elution peak from the oligomeric species. This result shows thatBTB dimers do not dissociate on the timescale ofSEC at low temperature and cannot form hetero‐oligomers withSPOP 28–359. However, incubation at 37°C for 90 min rendersBTB domain interactions dynamic enough to allow forBTB domain‐mediated exchange betweenWT andSPOP mutBACK (dark gray line). The hetero‐oligomers are smaller in size than oligomeric species observed forSPOP 28–359 alone at 533 μM (orange line).SEC chromatogram for mixtures of 533 μMSPOP 28–359 with 533 μM ofSPOP mutBTB is shown. Conversely, in mixtures ofSPOP 28–359 andSPOP mutBTB , which can effectively interact only through theBACK domain, the population of the higher‐order oligomeric species increased relative to that ofSPOP 28–359 alone, irrespective of incubation time or temperature (gray lines). However, the mixed oligomers are smaller thanSPOP 28–359 oligomers at an equimolar protein loading concentration (golden line).
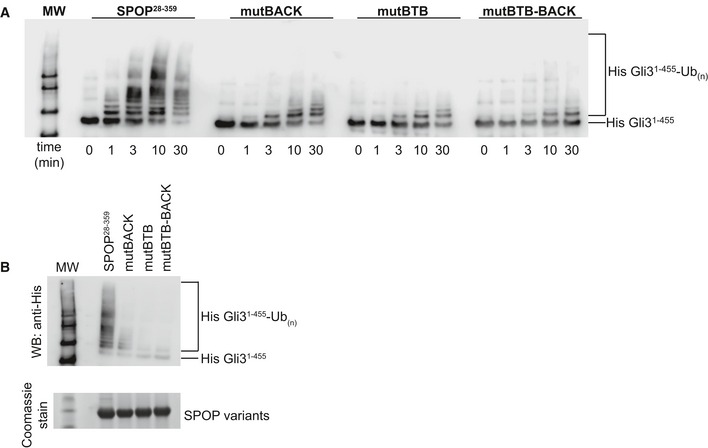
In vitro ubiquitination assays with
CRL 3SPOP were performed as described previously (Zhuang et al, 2009) using His‐Gli31–455 as a substrate,SPOP 28–359, and each of the self‐association‐incompetent mutants. The reaction was monitored for 30 min, and time points taken are indicated below the Western blot. Ubiquitination efficiency was monitored by immunoblotting with an anti‐His antibody.Reactions were performed as in (A) and monitored for 30 min. Equal amounts of
SPOP variants were used as shown in theSDS –PAGE gel.
- A
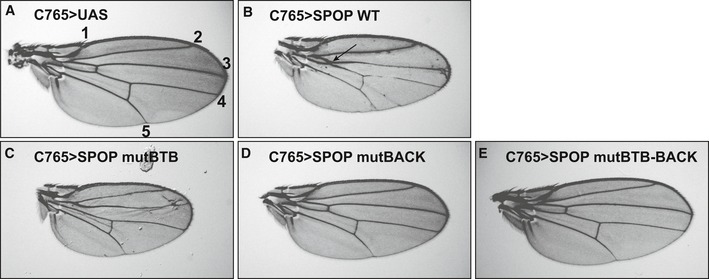
UAS vector served as a control and yielded a normal wing. Longitudinal veins are denoted by numbers 1–5. - B
Expression of
SPOP WT resulted in a modest Hh loss‐of‐function phenotype with fusion ofLV 3 andLV 4 (arrow). - C
mut
BTB acts in a dominant‐negative manner, as evidenced by a modest Hh gain‐of‐function phenotype with expansion of theLV 3–LV 4 intervein space. - D, E
Expression of (D) mut
BACK and (E) mutBTB –BACK does not induce a wing‐patterning defect.
References
-
- Abril AM, Salas M, Andreu JM, Hermoso JM, Rivas G (1997) Phage phi29 protein p6 is in a monomer‐dimer equilibrium that shifts to higher association states at the millimolar concentrations found in vivo . Biochemistry 36: 11901–11908 - PubMed
-
- Attri AK, Minton AP (2005a) New methods for measuring macromolecular interactions in solution via static light scattering: basic methodology and application to nonassociating and self‐associating proteins. Anal Biochem 337: 103–110 - PubMed
-
- Attri AK, Minton AP (2005b) Composition gradient static light scattering: a new technique for rapid detection and quantitative characterization of reversible macromolecular hetero‐associations in solution. Anal Biochem 346: 132–138 - PubMed
Publication types
MeSH terms
Substances
Grants and funding
LinkOut - more resources
Full Text Sources
Other Literature Sources
