

Noninvasive detection of enzyme activity in tumor models of human ovarian cancer using catalyCEST MRI
- PMID: 27221386
- PMCID: PMC5123981
- DOI: 10.1002/mrm.26278
Noninvasive detection of enzyme activity in tumor models of human ovarian cancer using catalyCEST MRI
Abstract
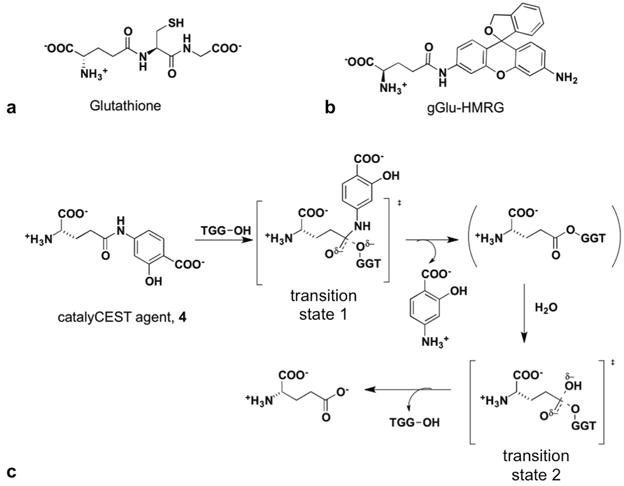
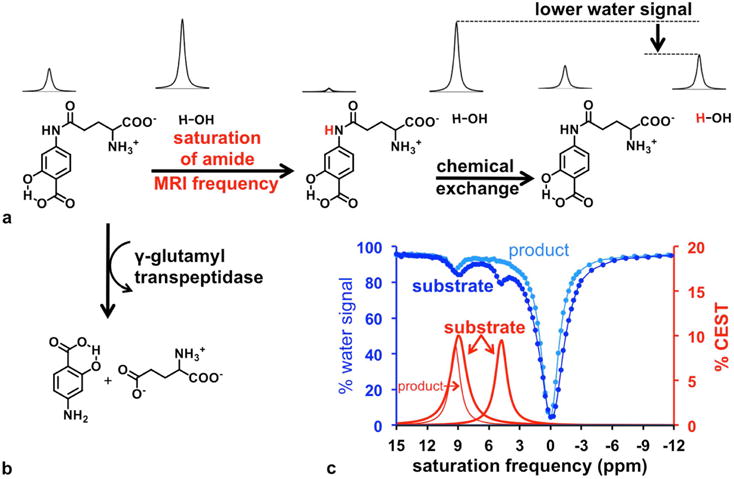
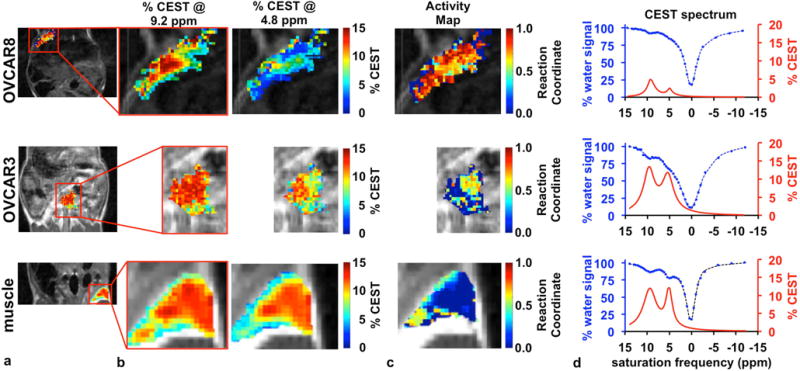
Purpose: We proposed to detect the in vivo enzyme activity of γ-glutamyl transferase (GGT) within mouse models of human ovarian cancers using catalyCEST MRI with a diamagnetic CEST agent.
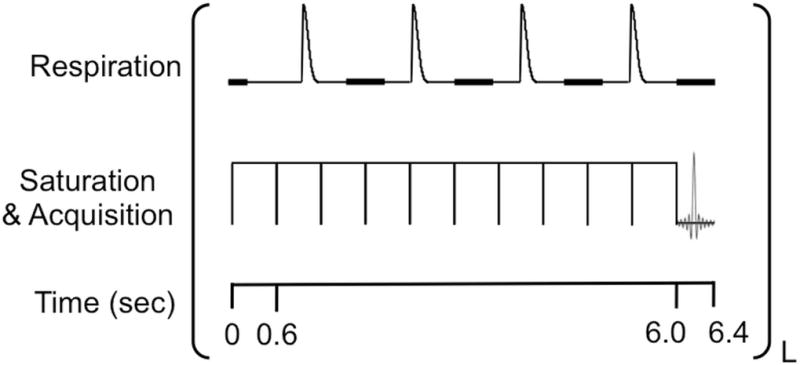
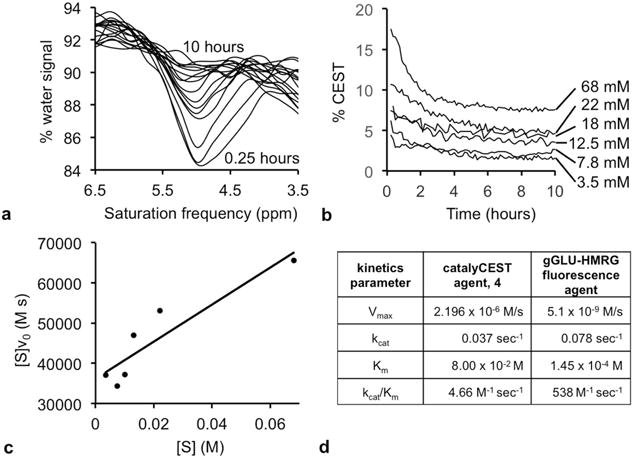
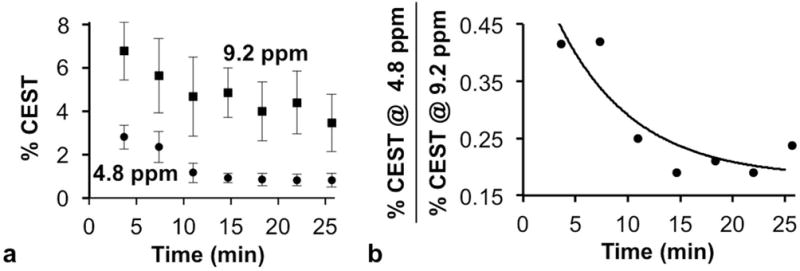
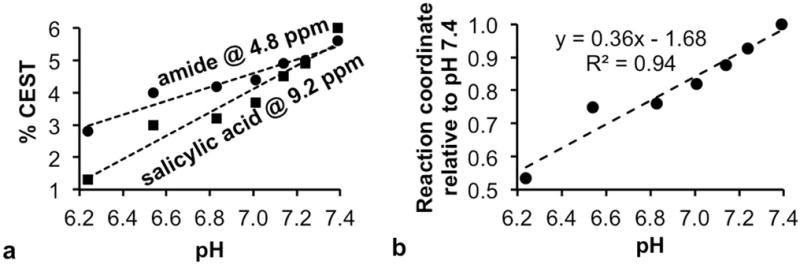
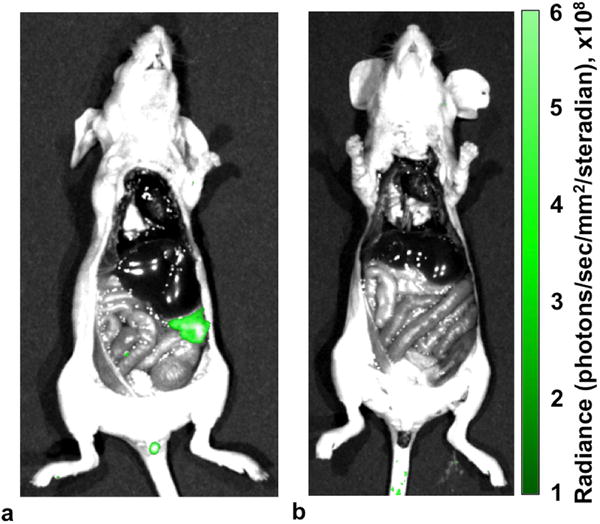
Methods: A CEST-FISP MRI protocol and a diamagnetic CEST agent were developed to detect GGT enzyme activity in biochemical solution. A quantitative Michaelis-Menten enzyme kinetics study was performed to confirm that catalyCEST MRI can measure enzyme activity. In vivo catalyCEST MRI studies generated pixel-wise activity maps of GGT activities. Ex vivo fluorescence imaging was performed for validation.
Results: CatalyCEST MRI selectively detected two CEST signals from a single CEST agent, whereby one CEST signal was responsive to GGT enzyme activity and the other CEST signal was an unresponsive control signal. The comparison of these CEST signals facilitated in vivo catalyCEST MRI studies that detected high GGT activity in OVCAR-8 tumors, low GGT activity in OVCAR-3 tumors, and low or no GGT activity in muscle tissues.
Conclusion: CatalyCEST MRI with a diamagnetic CEST agent can detect the level of GGT enzyme activity within in vivo tumor models of human ovarian cancers. Magn Reson Med 77:2005-2014, 2017. © 2016 International Society for Magnetic Resonance in Medicine.
Keywords: CEST MRI; enzyme activity; glutamyl transferase; molecular imaging; ovarian cancer.
© 2016 International Society for Magnetic Resonance in Medicine.
Conflict of interest statement
Figures
Similar articles
-
Assessments of tumor metabolism with CEST MRI.NMR Biomed. 2019 Oct;32(10):e3943. doi: 10.1002/nbm.3943. Epub 2018 Jun 25. NMR Biomed. 2019. PMID: 29938857 Free PMC article. Review.
-
Detecting in vivo urokinase plasminogen activator activity with a catalyCEST MRI contrast agent.NMR Biomed. 2017 Jul;30(7):10.1002/nbm.3721. doi: 10.1002/nbm.3721. Epub 2017 Mar 29. NMR Biomed. 2017. PMID: 28370884 Free PMC article.
-
Simultaneous Evaluations of pH and Enzyme Activity with a CEST MRI Contrast Agent.ACS Sens. 2021 Dec 24;6(12):4535-4544. doi: 10.1021/acssensors.1c02408. Epub 2021 Dec 2. ACS Sens. 2021. PMID: 34856102 Free PMC article.
-
Detection of in vivo enzyme activity with CatalyCEST MRI.Magn Reson Med. 2014 Mar;71(3):1221-30. doi: 10.1002/mrm.24763. Magn Reson Med. 2014. PMID: 23640714 Free PMC article.
-
Clinical applications of chemical exchange saturation transfer (CEST) MRI.J Magn Reson Imaging. 2018 Jan;47(1):11-27. doi: 10.1002/jmri.25838. Epub 2017 Aug 9. J Magn Reson Imaging. 2018. PMID: 28792646 Free PMC article. Review.
Cited by
-
Chemistry of MRI Contrast Agents: Current Challenges and New Frontiers.Chem Rev. 2019 Jan 23;119(2):957-1057. doi: 10.1021/acs.chemrev.8b00363. Epub 2018 Oct 16. Chem Rev. 2019. PMID: 30350585 Free PMC article. Review.
-
Angiopep-2 as an Exogenous Chemical Exchange Saturation Transfer Contrast Agent in Diagnosis of Alzheimer's Disease.J Healthc Eng. 2022 Apr 5;2022:7480519. doi: 10.1155/2022/7480519. eCollection 2022. J Healthc Eng. 2022. Retraction in: J Healthc Eng. 2023 May 24;2023:9832596. doi: 10.1155/2023/9832596. PMID: 35422975 Free PMC article. Retracted.
-
Assessments of tumor metabolism with CEST MRI.NMR Biomed. 2019 Oct;32(10):e3943. doi: 10.1002/nbm.3943. Epub 2018 Jun 25. NMR Biomed. 2019. PMID: 29938857 Free PMC article. Review.
-
Furin-mediated intracellular self-assembly of olsalazine nanoparticles for enhanced magnetic resonance imaging and tumour therapy.Nat Mater. 2019 Dec;18(12):1376-1383. doi: 10.1038/s41563-019-0503-4. Epub 2019 Oct 21. Nat Mater. 2019. PMID: 31636420 Free PMC article.
-
Triazoles as T2 -Exchange Magnetic Resonance Imaging Contrast Agents for the Detection of Nitrilase Activity.Chemistry. 2018 Oct 9;24(56):15013-15018. doi: 10.1002/chem.201802663. Epub 2018 Sep 10. Chemistry. 2018. PMID: 29989227 Free PMC article.
References
-
- Hanigan MH, Gallagher BC, Taylor PT, Large MK. Inhibition of γ-glutamyl transpeptidase activity by acivicin in vivo protects the kidney from cisplatin-induced toxicity. Cancer Res. 1994;54:5925–5929. - PubMed
-
- Yao D, Jiang D, Huang Z, Lu J, Tao Q, Yu Z, Meng X. Abnormal expression of hepatoma specific γ-glutamyl transferase and alteration of γ-glutamyl transferase gene methylation status in patients with hepatocellular carcinoma. Cancer. 2000;88:761–769. - PubMed
-
- Black SM, Wolf CR. The role of glutathione-dependent enzymes in drug resistance. Pharmac Ther. 1991;51:139–154. - PubMed
Publication types
MeSH terms
Substances
Grants and funding
LinkOut - more resources
Full Text Sources
Other Literature Sources
Medical
Miscellaneous
