. 2016 Jun;9(6):417-27.
doi: 10.1158/1940-6207.CAPR-16-0081. Epub 2016 May 24.

Genomic Landscape of Colorectal Mucosa and Adenomas

Affiliations

Genomic Landscape of Colorectal Mucosa and Adenomas

Ester Borras et al. Cancer Prev Res (Phila). 2016 Jun.

Abstract

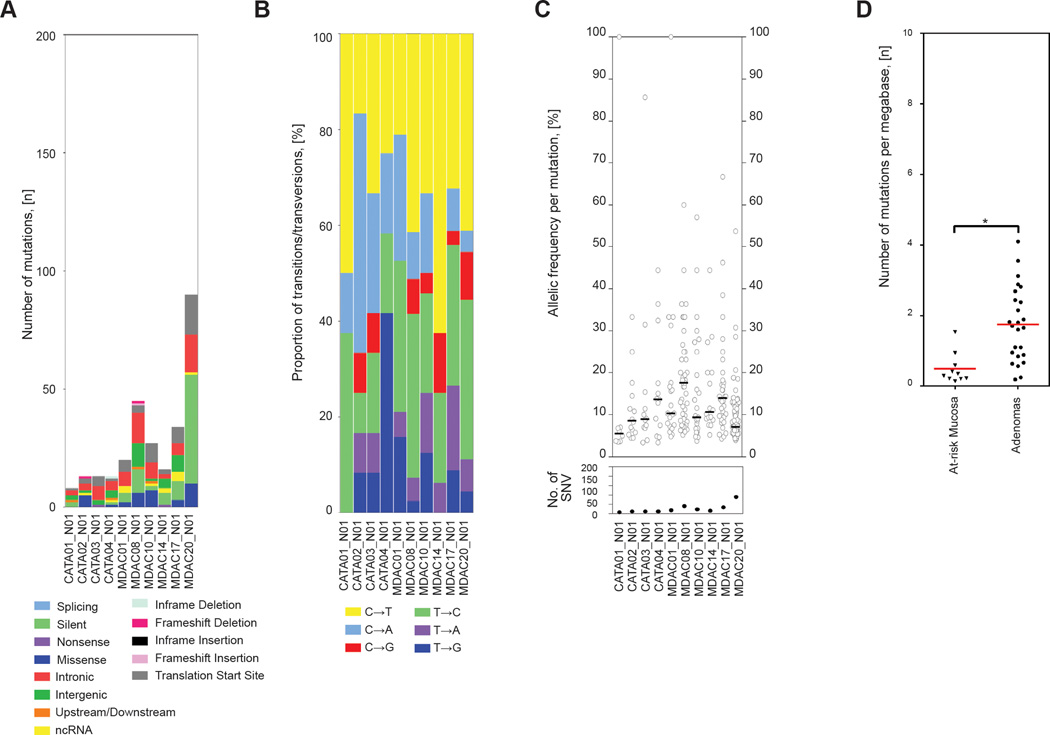
The molecular basis of the adenoma-to-carcinoma transition has been deduced using comparative analysis of genetic alterations observed through the sequential steps of intestinal carcinogenesis. However, comprehensive genomic analyses of adenomas and at-risk mucosa are still lacking. Therefore, our aim was to characterize the genomic landscape of colonic at-risk mucosa and adenomas. We analyzed the mutation profile and copy number changes of 25 adenomas and adjacent mucosa from 12 familial adenomatous polyposis patients using whole-exome sequencing and validated allelic imbalances (AI) in 37 adenomas using SNP arrays. We assessed for evidence of clonality and performed estimations on the proportions of driver and passenger mutations using a systems biology approach. Adenomas had lower mutational rates than did colorectal cancers and showed recurrent alterations in known cancer driver genes (APC, KRAS, FBXW7, TCF7L2) and AIs in chromosomes 5, 7, and 13. Moreover, 80% of adenomas had somatic alterations in WNT pathway genes. Adenomas displayed evidence of multiclonality similar to stage I carcinomas. Strong correlations between mutational rate and patient age were observed in at-risk mucosa and adenomas. Our data indicate that at least 23% of somatic mutations are present in at-risk mucosa prior to adenoma initiation. The genomic profiles of at-risk mucosa and adenomas illustrate the evolution from normal tissue to carcinoma via greater resolution of molecular changes at the inflection point of premalignant lesions. Furthermore, substantial genomic variation exists in at-risk mucosa before adenoma formation, and deregulation of the WNT pathway is required to foster carcinogenesis. Cancer Prev Res; 9(6); 417-27. ©2016 AACR.


Conflict of interest statement

Conflict of Interests: The authors have declared that no conflict of interest exists.

Figures

Figure 1
Figure 1
Exome analysis of colorectal adenomas. (A) Total number of mutations per adenoma classified in each of the categories displayed in the legend on the bottom. (B) Relative proportions of the 6 different possible base-pair substitutions, as indicated in the legend on the bottom. (C) Median mutation frequencies. For each sample, all the mutations are shown as circles indicating the allelic frequency of the respective mutant alleles. Median allele frequency is represented with a black solid bar and the allelic frequency of somatic APC mutations with a red circle. The total number of somatic mutations in each adenoma sample is displayed in the lower graph (SNV, single nucleotide variation). (D) Mean somatic mutation frequency observed in adenomas compared with CRCs from TCGA classified by hypermutator status. Averages are shown in red (*P < .0001).
Figure 2
Figure 2
AIs detected in colorectal adenomas. (A) Integrative analysis of genomic changes detected in adenomas and non-hypermutated stage I CRCs from the colorectal TCGA data set. AIs of the 22 autosomes are shown in shades of red for amplification, blue for deletion, and black for cn-LOH (adenomas only). Results in carcinomas are shaded by degree of imbalance, with red shades for amplification and blue for deletion (darker: greater copy number change in sample). (B) Summary of AIs detected in adenomas and non-hypermutated stage I CRCs from the colorectal TCGA data set.
Figure 3
Figure 3
Genome-wide mutational landscape and genomic changes in colorectal adenomas. (A) Mutational rate in colorectal adenomas. (B) Key clinicopathological characteristics including sex (M, male; F, female), diagnosis of cancer, location of the germline APC mutation (Out15, mutations locate outside of exon 15; In15, mutations located inside of exon 15), and type of germline APC mutation (Del, deletions; Sp, splicing mutations; Non, nonsense mutations). (C) Summary of mutations and AIs in selected genes. Each row is a gene and each column is a sample. Mutations and AIs are colored by the type of alteration as indicated in the legend. Left, total number of somatic alterations that targeted each gene and the percentage of individuals affected. Right, heat map displaying frequencies of carcinomas mutated in each gene from TCGA data set.
Figure 4
Figure 4
Clonality analysis of colorectal adenomas. (A) Mutation counts detected by whole-exome sequencing in 4 different adenomas, ordered by allelic frequency and provided as examples presenting evidence of clonality. (B, C) Purity and ploidy of adenomas and stage I CRCs were estimated by the ABSOLUTE computational method (*P < .0001). (D) Numbers of clones in adenomas were inferred by clustering cancer cell fraction of mutations estimated by ABSOLUTE.
Figure 5
Figure 5
Exome analysis of at-risk mucosa samples. (A) Total number of mutations per at-risk mucosa classified in each of the categories displayed in the legend on the bottom. (B) Relative proportions of the 6 different possible base-pair substitutions. (C) Median mutation frequencies. For each sample, all the mutations are shown as circles indicating the allelic frequency of the respective mutant alleles. Median allele frequency is represented with a black solid bar. The total number of somatic mutations in each sample is displayed in the graph below (SNV). (D) Mean somatic mutation frequency observed in the mucosa compared with adenomas. Averages are shown in red (*P < .001).
Figure 6
Figure 6
Proportion of drivers and passengers. (A) Correlation analysis of mutation rate versus age in adenomas. (B) Correlation analysis of mutation rate versus age in at-risk mucosa samples. (C) Correlation between numbers of passenger mutations versus drivers, in adenomas. (D) Correlation between age versus numbers of passenger mutations, in adenomas. (E) Correlation between numbers of passenger mutations versus age in adenomas and at-risk mucosa. Correlation is shown in red for adenomas and in green for at-risk mucosa samples. (F) Correlation between numbers of passenger mutations observed in our set of adenoma samples versus estimations based on mathematical models.

References

    1. Siegel RL, Miller KD, Jemal A. Cancer statistics, 2015. CA Cancer J Clin. 2015;65:5–29. - PubMed
    1. Fearon ER. Molecular genetics of colorectal cancer. Annu Rev Pathol. 2011;6:479–507. - PubMed
    1. Diamond SJ, Enestvedt BK, Jiang Z, Holub JL, Gupta M, Lieberman DA, et al. Adenoma detection rate increases with each decade of life after 50 years of age. Gastrointest Endosc. 2011;74:135–140. - PMC - PubMed
    1. Sparks AB, Morin PJ, Vogelstein B, Kinzler KW. Mutational analysis of the APC/beta-catenin/Tcf pathway in colorectal cancer. Cancer Res. 1998;58:1130–1134. - PubMed
    1. Galiatsatos P, Foulkes WD. Familial adenomatous polyposis. Am J Gastroenterol. 2006;101:385–398. - PubMed

Publication types