

Involvement of the P2X7-NLRP3 axis in leukemic cell proliferation and death
- PMID: 27221966
- PMCID: PMC4879576
- DOI: 10.1038/srep26280
Involvement of the P2X7-NLRP3 axis in leukemic cell proliferation and death
Abstract
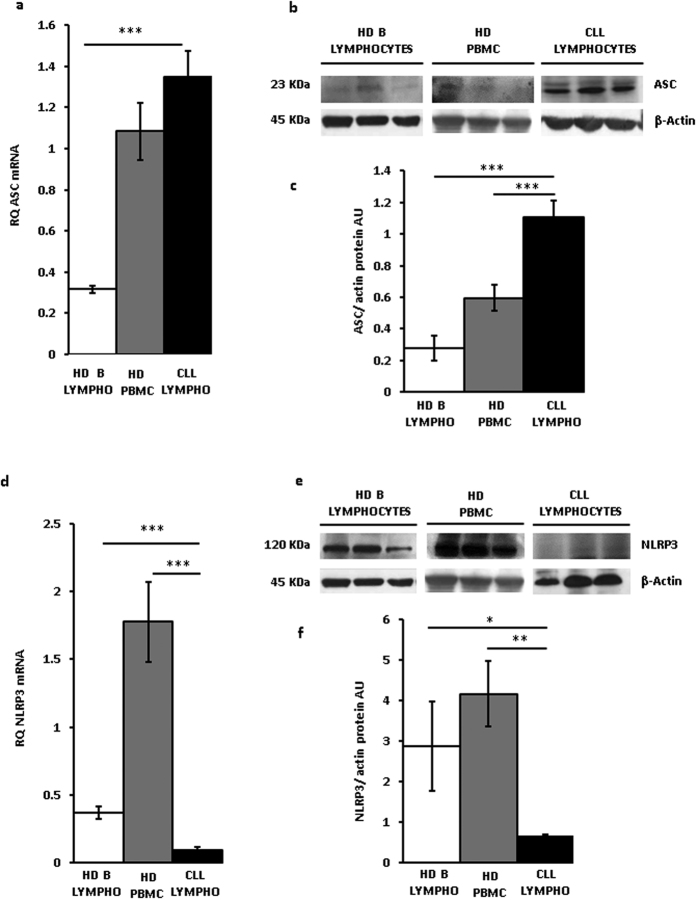
Lymphocyte growth and differentiation are modulated by extracellular nucleotides and P2 receptors. We previously showed that the P2X7 receptor (P2X7R or P2RX7) is overexpressed in circulating lymphocytes from chronic lymphocytic leukemia (CLL) patients. In the present study we investigated the P2X7R/NLRP3 inflammasome axis in lymphocytes from a cohort of 23 CLL patients. P2X7R, ASC and NLRP3 were investigated by Western blot, PCR and transfection techniques. P2X7R was overexpressed and correlated with chromosome 12 trisomy in CLL patients. ASC mRNA and protein were also overexpressed. On the contrary, NLRP3 was dramatically down-modulated in CLL lymphocytes relative to lymphocytes from healthy donors. To further investigate the correlation between P2X7R, NLRP3 and cell growth, NLRP3 was silenced in THP-1 cells, a leukemic cell line that natively expresses both NLRP3 and P2X7R. NLRP3 silencing enhanced P2X7R expression and promoted growth. On the contrary, NLRP3 overexpression caused accelerated apoptosis. The P2X7R was also up-modulated in hematopoietic cells from NLRP3-KO mice. In conclusion, we show that NLRP3 down-modulation stimulates P2X7R expression and promotes growth, while NLRP3 overexpression inhibits cell proliferation and stimulates apoptosis. These findings suggest that NLRP3 is a negative regulator of growth and point to a role of the P2X7R/NLRP3 axis in CLL.
Figures


Similar articles
-
Potentiation of hepatic stellate cell activation by extracellular ATP is dependent on P2X7R-mediated NLRP3 inflammasome activation.Pharmacol Res. 2017 Mar;117:82-93. doi: 10.1016/j.phrs.2016.11.040. Epub 2016 Dec 8. Pharmacol Res. 2017. PMID: 27940204
-
Purinergic 2X7 Receptor is Involved in the Podocyte Damage of Obesity-Related Glomerulopathy via Activating Nucleotide-Binding and Oligomerization Domain-Like Receptor Protein 3 Inflammasome.Chin Med J (Engl). 2018 Nov 20;131(22):2713-2725. doi: 10.4103/0366-6999.245270. Chin Med J (Engl). 2018. PMID: 30425198 Free PMC article.
-
P2X7 receptor deficiency attenuates cisplatin-induced kidney injury via inhibiting NLRP3 inflammasome activation.Biochem Pharmacol. 2024 Aug;226:116369. doi: 10.1016/j.bcp.2024.116369. Epub 2024 Jun 14. Biochem Pharmacol. 2024. PMID: 38880358
-
The Purinergic P2X7 Receptor-NLRP3 Inflammasome Pathway: A New Target in Alcoholic Liver Disease?Int J Mol Sci. 2021 Feb 21;22(4):2139. doi: 10.3390/ijms22042139. Int J Mol Sci. 2021. PMID: 33670021 Free PMC article. Review.
-
Purinergic receptors: new targets for the treatment of gout and fibrosis.Fundam Clin Pharmacol. 2017 Apr;31(2):136-146. doi: 10.1111/fcp.12256. Epub 2016 Dec 30. Fundam Clin Pharmacol. 2017. PMID: 27885718 Review.
Cited by
-
Extracellular ATP is increased by release of ATP-loaded microparticles triggered by nutrient deprivation.Theranostics. 2022 Jan 1;12(2):859-874. doi: 10.7150/thno.66274. eCollection 2022. Theranostics. 2022. PMID: 34976217 Free PMC article.
-
The P2X7 Receptor-Interleukin-1 Liaison.Front Pharmacol. 2017 Mar 16;8:123. doi: 10.3389/fphar.2017.00123. eCollection 2017. Front Pharmacol. 2017. PMID: 28360855 Free PMC article. Review.
-
Research Progress on Pyroptosis in Hematological Malignancies.Curr Treat Options Oncol. 2023 Oct;24(10):1439-1450. doi: 10.1007/s11864-023-01119-7. Epub 2023 Aug 28. Curr Treat Options Oncol. 2023. PMID: 37635159 Free PMC article. Review.
-
The Complement Cascade as a Mediator of Human Malignant Hematopoietic Cell Trafficking.Front Immunol. 2019 Jun 7;10:1292. doi: 10.3389/fimmu.2019.01292. eCollection 2019. Front Immunol. 2019. PMID: 31231394 Free PMC article.
-
Involvement of P2 receptors in hematopoiesis and hematopoietic disorders, and as pharmacological targets.Purinergic Signal. 2020 Mar;16(1):1-15. doi: 10.1007/s11302-019-09684-z. Epub 2019 Dec 20. Purinergic Signal. 2020. PMID: 31863258 Free PMC article. Review.
References
-
- Lamkanfi M. & Dixit V. M. Mechanisms and Functions of Inflammasomes. Cell. 157, 1013–1022 (2014). - PubMed
-
- Di Virgilio F. The therapeutic potential of modifying inflammasomes and NOD-like receptors. Pharmacol. Rev. 65, 872–905 (2013). - PubMed
-
- Franceschini A. et al.. The P2X7 receptor directly interacts with the NLRP3 inflammasome scaffold protein. FASEB J. 29, 2450–2461 (2015). - PubMed
-
- Dinarello C. A. Immunological and inflammatory functions of the interleukin-1 family. Annu. Rev. Immunol. 27, 519–550 (2009). - PubMed
Publication types
MeSH terms
Substances
Grants and funding
LinkOut - more resources
Full Text Sources
Other Literature Sources
Research Materials
Miscellaneous
