. 2016 Aug;46(8):1970-83.
doi: 10.1002/eji.201545861. Epub 2016 Jun 13.

Leptin directly promotes T-cell glycolytic metabolism to drive effector T-cell differentiation in a mouse model of autoimmunity

Affiliations

Leptin directly promotes T-cell glycolytic metabolism to drive effector T-cell differentiation in a mouse model of autoimmunity

Valerie A Gerriets et al. Eur J Immunol. 2016 Aug.

Abstract

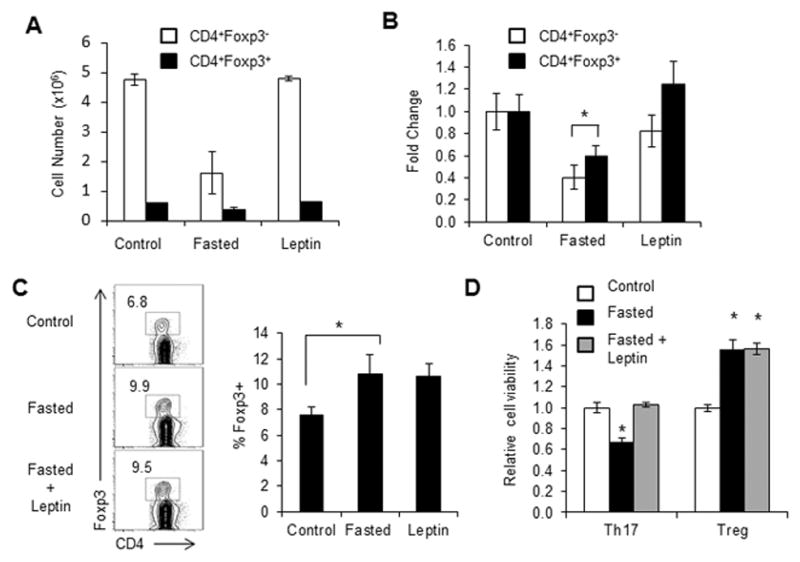
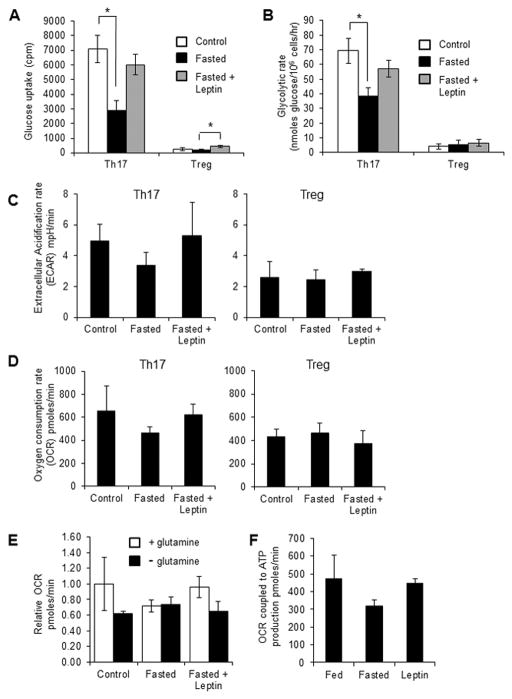
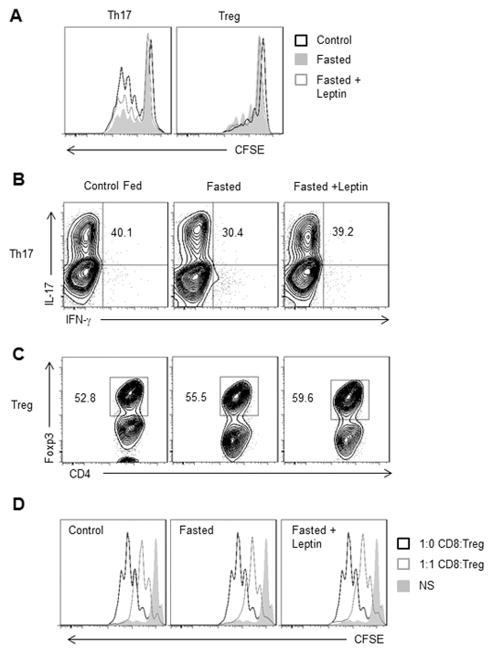
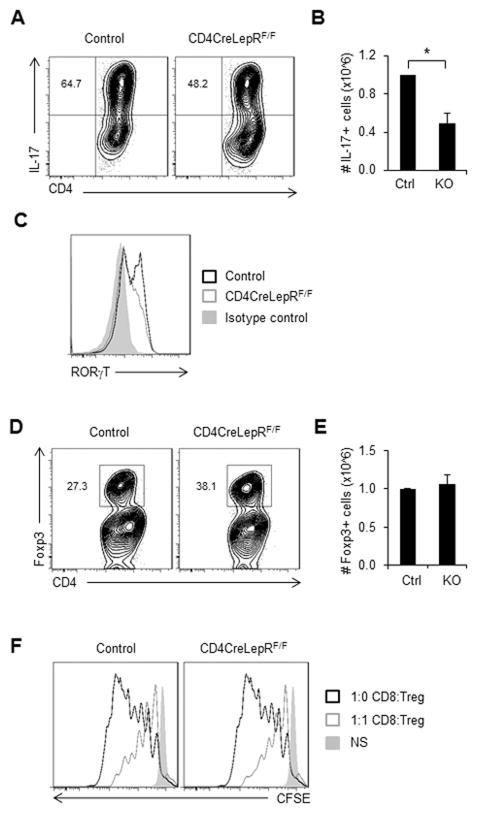
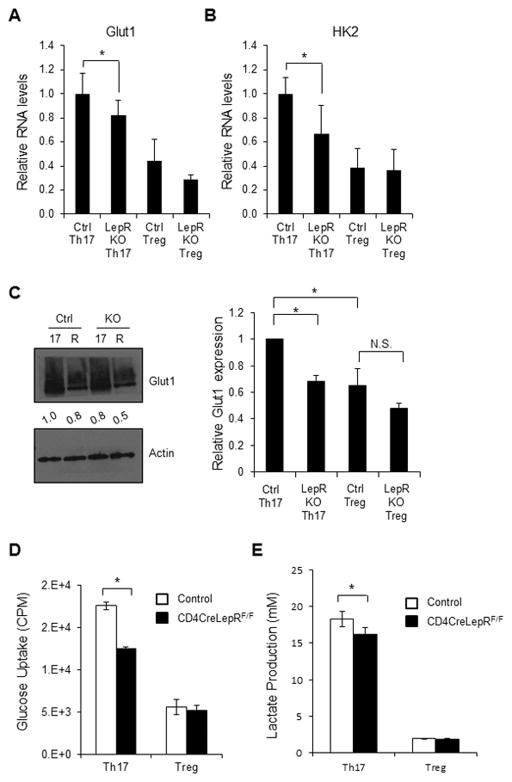
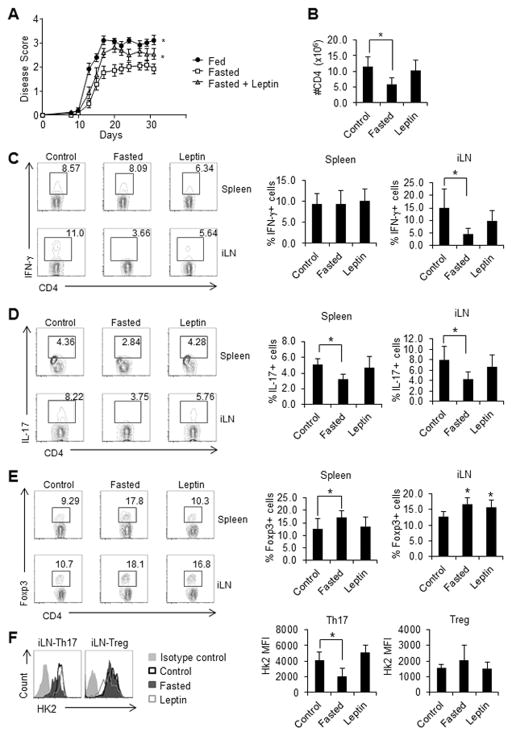
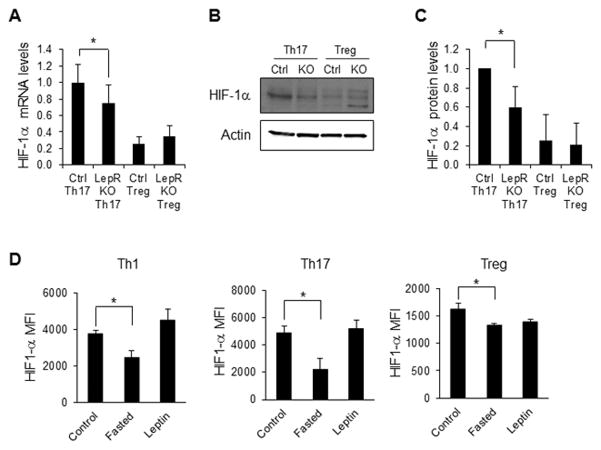
Upon activation, T cells require energy for growth, proliferation, and function. Effector T (Teff) cells, such as Th1 and Th17 cells, utilize high levels of glycolytic metabolism to fuel proliferation and function. In contrast, Treg cells require oxidative metabolism to fuel suppressive function. It remains unknown how Teff/Treg-cell metabolism is altered when nutrients are limited and leptin levels are low. We therefore examined the role of malnutrition and associated hypoleptinemia on Teff versus Treg cells. We found that both malnutrition-associated hypoleptinemia and T cell-specific leptin receptor knockout suppressed Teff-cell number, function, and glucose metabolism, but did not alter Treg-cell metabolism or suppressive function. Using the autoimmune mouse model EAE, we confirmed that fasting-induced hypoleptinemia altered Teff-cell, but not Treg-cell, glucose metabolism, and function in vivo, leading to decreased disease severity. To explore potential mechanisms, we examined HIF-1α, a key regulator of Th17 differentiation and Teff-cell glucose metabolism, and found HIF-1α expression was decreased in T cell-specific leptin receptor knockout Th17 cells, and in Teff cells from fasted EAE mice, but was unchanged in Treg cells. Altogether, these data demonstrate a selective, cell-intrinsic requirement for leptin to upregulate glucose metabolism and maintain function in Teff, but not Treg cells.

Keywords: EAE; Glucose metabolism; HIF-1α; Leptin; Malnutrition; Th17; Treg cells.


Conflict of interest statement

Statement The authors declare no commercial or financial conflict of interest.

Figures

Figure 1
Figure 1. Fasting-induced hypoleptinemia suppresses Teff, but not Treg, number
Wildtype C57BL/6J mice were fed ad libitum (control) or fasted for 48 hours (fasted). Fasted mice received twice daily injections of leptin or PBS. Control fed mice also received PBS injections. (A–B) The numbers of CD4+Foxp3+ and CD4+Foxp3 T cells from control or fasted mice or fasted mice given leptin injections were assessed by intracellular transcription factor staining using anti-Foxp3-PE. (A) Cell number and (B) relative fold change were compared. (C) Representative FACS plot of live CD4+ T cells stained for intracellular Foxp3. Quantified Foxp3 percentages are shown. (D) CD4+ T cells from control or fasted mice or fasted mice given leptin injections were polarized in vitro for 5 days to generate Th17 or Treg cells. Cell survival was determined by propidium iodide exclusion relative to T cells from fed controls. (A, B, D) Data are shown as mean ± SD of triplicate samples and are representative of 3 independent experiments. * indicates p < 0.05 by Student’s t-test.
Figure 2
Figure 2. Fasting-induced hypoleptinemia suppresses Th17, but not Treg, metabolism
Wildtype C57BL/6J mice were fed ad libitum (control) or fasted for 48 hours (fasted). Fasted mice received twice daily injections of leptin or PBS. Control fed mice also received PBS injections. CD4+ T cells from control or fasted mice or fasted mice given leptin injections were polarized in vitro for 5 days to generate Th17 or Treg cells. (A) Glucose uptake and (B) glycolytic rate were assessed in Th17 and Treg. Data are shown as mean ± SD of triplicate samples and are representative of 3 independent experiments. (C–D) Extracellular acidification rates and basal oxygen consumption rates were measured using a Seahorse Extracellular Flux Analyzer in Th17 and Treg cells. Data are representative of two independent experiments. (E) Oxygen consumption rates were measured in Th17 cells in the presence or absence of glutamine. (F) Oxygen consumption rates coupled to ATP production were calculated in Th17 cells by measuring oxygen consumption before and after oligomycin treatment. Data are representative of two independent experiments. * indicates p < 0.05 by Student’s t-test.
Figure 3
Figure 3. Fasting-induced hypoleptinemia suppresses Th17, but not Treg, proliferation and function
CD4+ T cells from control fed C57BL/6J mice, fasted mice, or fasted mice receiving twice daily leptin injections were isolated from spleen and polarized in vitro to generate Th17 or Treg cells. (A) Representative histograms of Th17 (CD4+IL-17+) and Treg (CD4+Foxp3+) cells that were labeled with CFSE on day 0 of polarization. Proliferation was measured by CFSE dilution after 3 days. (B) IL-17 production was measured in Th17 cells gated on live CD4+ T cells by intracellular flow cytometry using anti-IL-17-PE. (C and D) Treg differentiation and function was measured by (C) intracellular transcription factor staining for Foxp3 gated on live CD4+ T cells and (D) Representative histograms showing proliferation data from in vitro Treg suppression assay where CD8+ T cells were labeled with CFSE, cultured at a 1:1 ratio with Treg and then proliferation of live CD8+ T cells was measured by CFSE dilution after 3 days. All data are representative of 3 independent experiments.
Figure 4
Figure 4. T cell-specific leptin receptor knockout inhibits Th17, but not Treg, differentiation and function
CD4+ T cells from CD4CreLepRF/F or littermate control mice were isolated from spleen and polarized in vitro for 5 days to generate Th17 or Treg cells. (A–C) Th17 differentiation and function were assessed by intracellular cytokine staining for (A) IL-17 production gated on live CD4+ T cells. (B) The number of IL-17 producing live CD4+ T cells was quantified. (C) Representative histogram of live CD4+ T cells stained for intracellular RORγt. (D–F) Treg differentiation and function were measured by (D) intracellular transcription factor staining for Foxp3 gated on live CD4+ T cells. (E) number of live CD4+Foxp3+ T cells was quantified. (F) Representative histograms showing proliferation data from in vitro Treg suppression assay where CD8 T cells were labeled with CFSE, cultured at a 1:1 ratio with Treg and then proliferation of live CD8+ T cells was measured by CFSE dilution after 3 days. All data are representative of 3 independent experiments. (B and E) Data are shown as mean ± SD of triplicate samples. * indicates p < 0.05 by Student’s t-test.
Figure 5
Figure 5. T cell-specific leptin receptor knockout inhibits Th17, but not Treg, glucose metabolism
CD4+ T cells from CD4CreLepRF/F or littermate control mice were isolated from spleen and polarized in vitro for 5 days to generate Th17 or Treg cells. (A and B) RNA was isolated from Th17 and Treg to measure (A) Glut1 and (B) Hexokinase 2 (HK2) RNA levels relative to actin using the delta-delta Ct method. (C) Glut1 protein levels were measured by immunoblot. Glut1 is heavily glycosylated and appears as a smear. Bands were quantified relative to actin using ImageJ software and were normalized to the levels of control Th17 cells. Relative Glut1 protein expression, as normalized to actin, was averaged from three independent experiments. (D) Glucose uptake and (E) lactate production were measured in Th17 and Treg. All data are representative of 3 independent experiments. Data are shown as mean ± SD of triplicate samples. * indicates p < 0.05 by Student’s t-test.
Figure 6
Figure 6. Fasting-induced hypoleptinemia protects against EAE by inhibiting Th17 metabolism and function
EAE was induced in wildtype C57BL/6J mice that were fed ad libitum (control), fasted for 48 hours, or fasted while receiving twice daily leptin injections (13 mice per group). (A) Starting at day 9 post EAE-induction, mice were given thrice-weekly clinical disease scores, with higher numbers reflecting more severe disease as detailed in Materials and methods. (B) The number of live CD4+ T cells in the draining lymph nodes on day 9 was determined using flow cytometry. (C –E) The percentages of live (C) CD4+IFN-γ+, (D) CD4+IL-17+, and (E) CD4+Foxp3+ T cells in spleen and the draining lymph nodes (iLN) were determined by intracellular flow cytometry. (F) Intracellular staining for hexokinase 2 (HK2) in Th17 (CD4+IL-17+) and Treg (CD4+Foxp3+) from draining lymph nodes. The experiment was repeated 4 independent times. (A) Data was analyzed by two-way ANOVA. Data are shown as mean ± SD of 8 (BE) or 5 (F) mice. * indicates p < 0.05 by Student’s t-test.
Figure 7
Figure 7. T cell-specific leptin receptor knockout Th17 cells have decreased HIF-1α expression
CD4+ T cells from CD4CreLepRF/F or littermate control mice were isolated from spleen and polarized in vitro for 5 days to generate Th17 or Treg cells. (A) HIF-1α RNA levels were assessed by qPCR relative to actin using the delta-delta Ct method. (B and C) HIF-1α protein levels were assessed by immunoblotting. Bands were quantified relative to actin using ImageJ software and were normalized to the levels of control Th17 cells. All data are representative of 3 independent experiments. (D) EAE was induced in wildtype C57BL/6J mice that were fed ad libitum (control), fasted for 48 hours, or fasted while receiving twice daily leptin injections (leptin). Intracellular staining for HIF-1α was determined in Th1 (CD4+IFN-γ+), Th17 (CD4+IL-17+), and Treg (CD4+Foxp3+) cells (5 mice per group). (A, C, D) Data are shown as mean ± SD of triplicate samples. * indicates p < 0.05 by Student’s t-test.

References

    1. Zhu J, Yamane H, Paul WE. Differentiation of effector CD4 T cell populations (*) Annu Rev Immunol. 2010;28:445–489. - PMC - PubMed
    1. Cua DJ, Sherlock J, Chen Y, Murphy CA, Joyce B, Seymour B, Lucian L, To W, Kwan S, Churakova T, Zurawski S, Wiekowski M, Lira SA, Gorman D, Kastelein RA, Sedgwick JD. Interleukin-23 rather than interleukin-12 is the critical cytokine for autoimmune inflammation of the brain. Nature. 2003;421:744–748. - PubMed
    1. Korn T, Bettelli E, Oukka M, Kuchroo VK. IL-17 and Th17 Cells. Annu Rev Immunol. 2009;27:485–517. - PubMed
    1. Cosmi L, Liotta F, Maggi E, Romagnani S, Annunziato F. Th17 and non-classic Th1 cells in chronic inflammatory disorders: two sides of the same coin. Int Arch Allergy Immunol. 2014;164:171–177. - PubMed
    1. Eisenstein EM, Williams CB. The T(reg)/Th17 cell balance: a new paradigm for autoimmunity. Pediatr Res. 2009;65:26R–31R. - PubMed

Publication types

LinkOut - more resources