Clinical Trial
. 2016 Jul 21;128(3):384-94.
doi: 10.1182/blood-2015-12-687749. Epub 2016 May 24.

Daratumumab depletes CD38+ immune regulatory cells, promotes T-cell expansion, and skews T-cell repertoire in multiple myeloma

Affiliations
Clinical Trial

Daratumumab depletes CD38+ immune regulatory cells, promotes T-cell expansion, and skews T-cell repertoire in multiple myeloma

Jakub Krejcik et al. Blood. .

Abstract

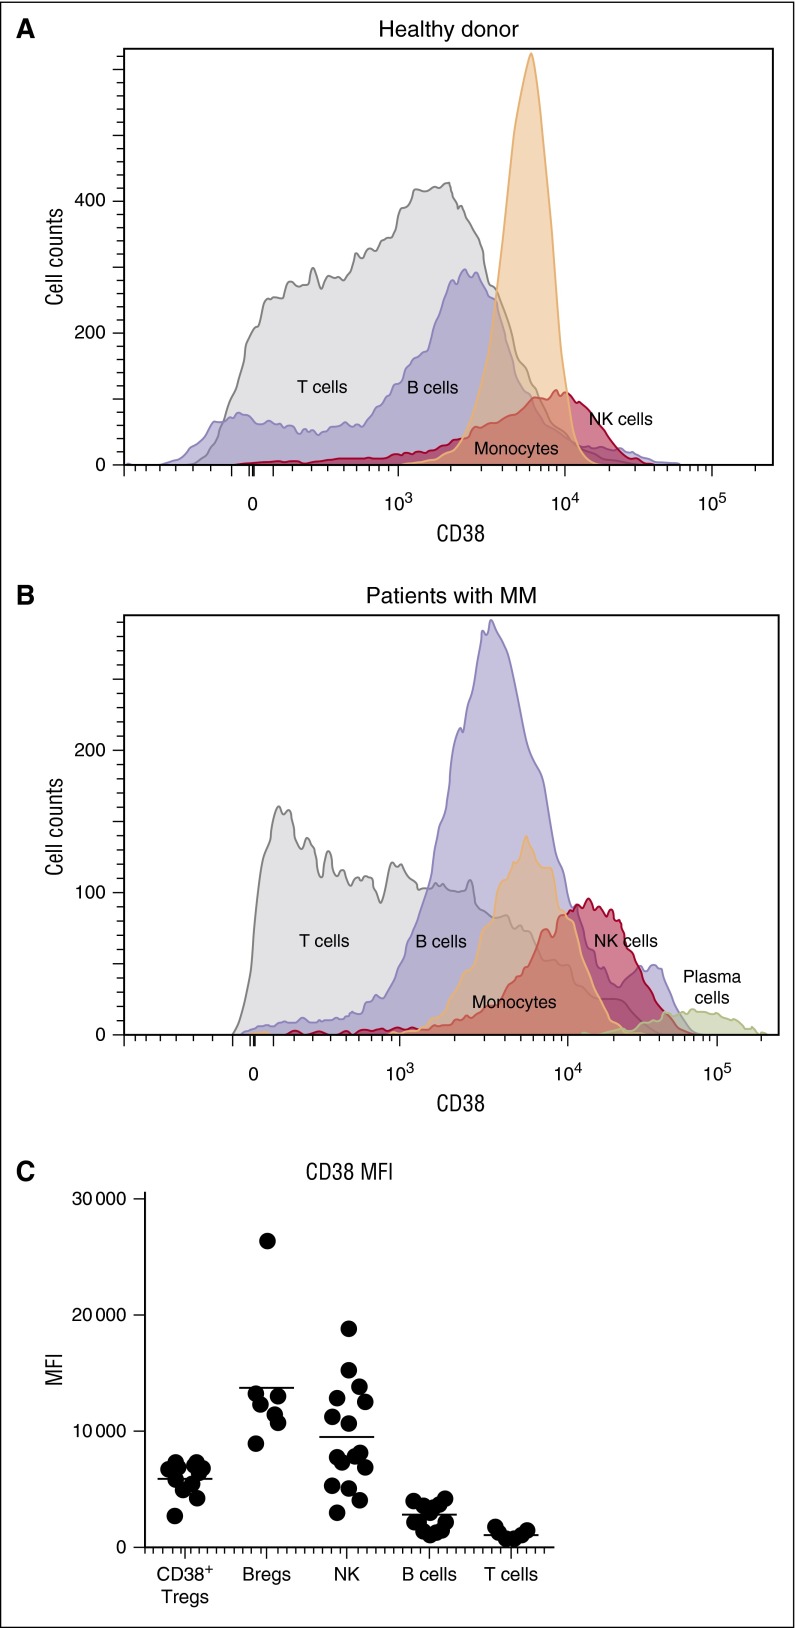
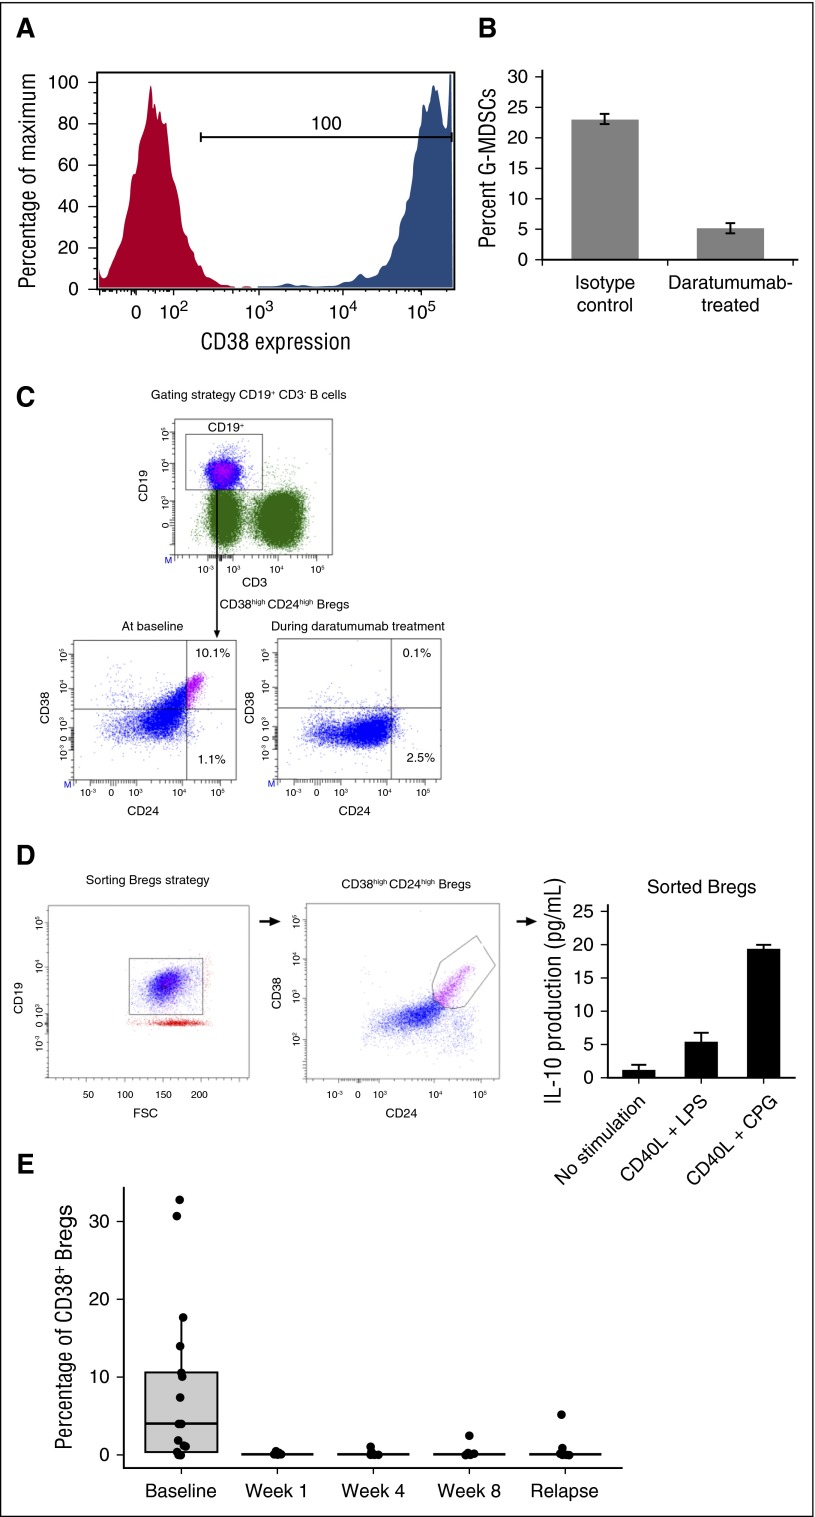
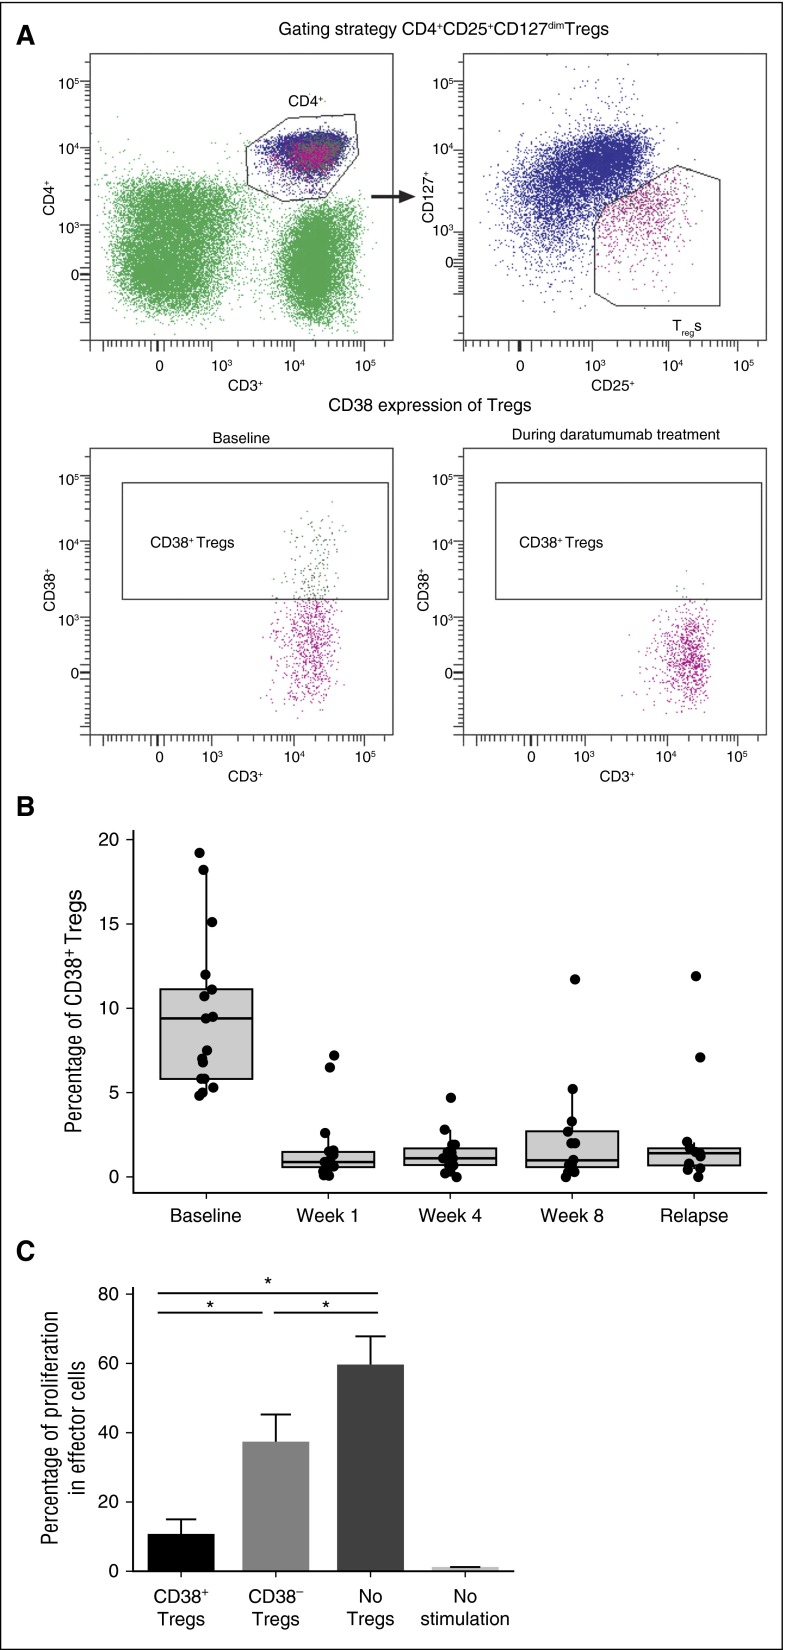
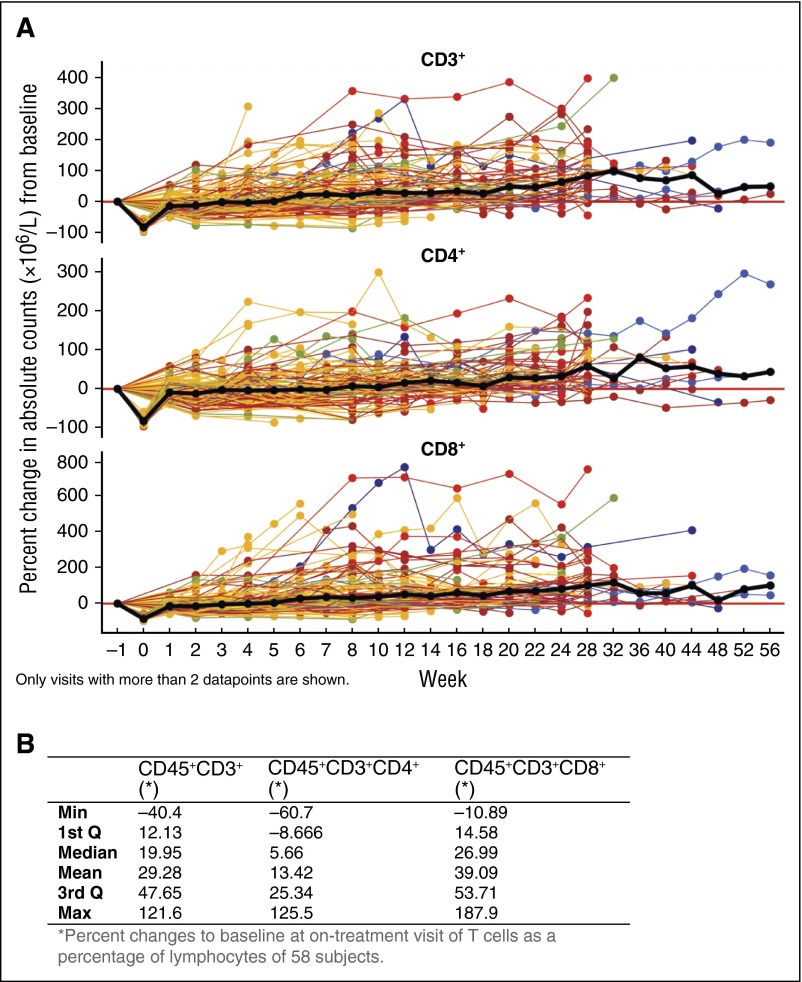
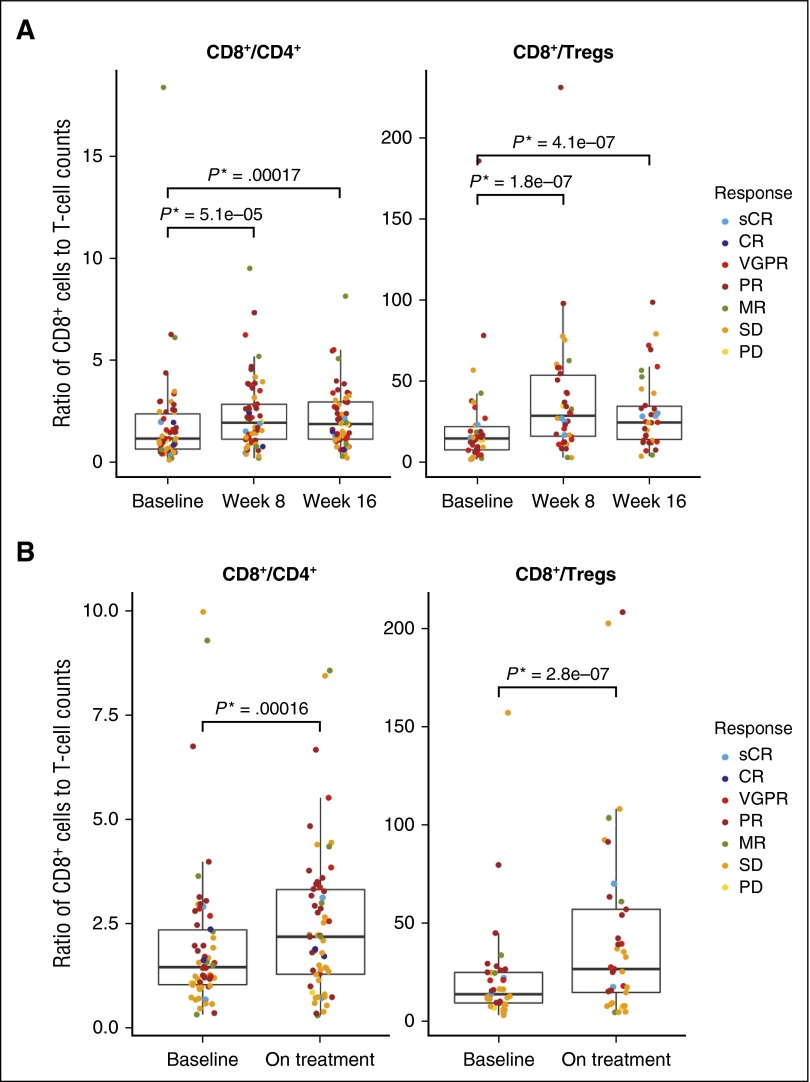
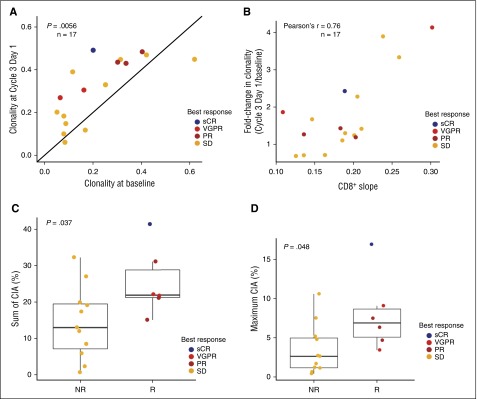
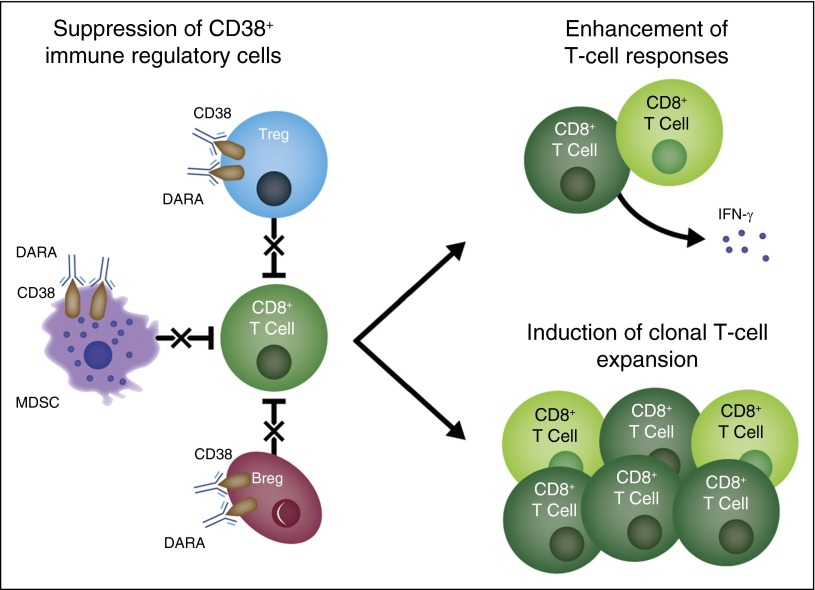
Daratumumab targets CD38-expressing myeloma cells through a variety of immune-mediated mechanisms (complement-dependent cytotoxicity, antibody-dependent cell-mediated cytotoxicity, and antibody-dependent cellular phagocytosis) and direct apoptosis with crosslinking. These mechanisms may also target nonplasma cells that express CD38, which prompted evaluation of daratumumab's effects on CD38-positive immune subpopulations. Peripheral blood (PB) and bone marrow (BM) from patients with relapsed/refractory myeloma from 2 daratumumab monotherapy studies were analyzed before and during therapy and at relapse. Regulatory B cells and myeloid-derived suppressor cells, previously shown to express CD38, were evaluated for immunosuppressive activity and daratumumab sensitivity in the myeloma setting. A novel subpopulation of regulatory T cells (Tregs) expressing CD38 was identified. These Tregs were more immunosuppressive in vitro than CD38-negative Tregs and were reduced in daratumumab-treated patients. In parallel, daratumumab induced robust increases in helper and cytotoxic T-cell absolute counts. In PB and BM, daratumumab induced significant increases in CD8(+):CD4(+) and CD8(+):Treg ratios, and increased memory T cells while decreasing naïve T cells. The majority of patients demonstrated these broad T-cell changes, although patients with a partial response or better showed greater maximum effector and helper T-cell increases, elevated antiviral and alloreactive functional responses, and significantly greater increases in T-cell clonality as measured by T-cell receptor (TCR) sequencing. Increased TCR clonality positively correlated with increased CD8(+) PB T-cell counts. Depletion of CD38(+) immunosuppressive cells, which is associated with an increase in T-helper cells, cytotoxic T cells, T-cell functional response, and TCR clonality, represents possible additional mechanisms of action for daratumumab and deserves further exploration.


Figures

Figure 1
Figure 1
CD38 expression in various cell populations. Histograms show expression of CD38 in T cells, B cells, monocytes, and NK cells (A) in a healthy donor and (B) in a patient with MM. CD38 expression in plasma cells from the myeloma patient is also shown. (C) Subpopulations of NK cells, Tregs, Bregs, and MDSCs from relapsed and refractory myeloma patients expressed higher levels of CD38 compared with CD8+ and CD4+ T cells. MFI, mean fluorescent intensity.
Figure 2
Figure 2
Immunosuppressive cells express CD38 and are sensitive to daratumumab. G-MDSCs (CD11b+CD14HLADRCD15+CD33+) were generated from 6-day cocultures with healthy donor PBMCs and myeloma cell lines as previously described. G-MDSCs were sorted and evaluated for CD38 expression (red represents the isotype control and blue indicates the CD38+ staining) and (A) sensitivity to isotype or (B) daratumumab-mediated ADCC/CDC. (C) Bregs express CD38 and, when stimulated, (D) produced IL-10. (E) CD38+ Bregs decreased and remained depleted following daratumumab treatment.
Figure 3
Figure 3
Effect of daratumumab on CD38+ Tregs in PB. (A) In a representative experiment, the gating strategy of Tregs is shown (upper), and 18.2% of Tregs expressing CD38 were depleted after the first daratumumab infusion (lower). (B) CD38+ Tregs were reduced and remained low during weeks 1, 4, and 8 of daratumumab therapy. (C) In experiments performed on samples from multiple healthy donors, cell proliferation was assessed through the dilution of CFSE dye due to cell division; strong inhibition of cell division was observed in the presence of CD38+ Tregs, in contrast to the partial inhibition of proliferation observed in the presence of CD38 Tregs or negative controls. Error bars represent standard error. Asterisks denote significant changes.
Figure 4
Figure 4
Effect of daratumumab treatment on helper and cytotoxic T-cell counts. (A) Longitudinal data representation of the percent change from baseline of absolute CD3+, CD4+, and CD8+ T-cell counts over time in PB; lines represent connected data points of individual patients that are colored by best overall clinical response: blue, sCR; orange, VGPR; brown, PR; yellow, SD; green, MR. The black bold line shows the overall median percent change over time. Only visits with >2 data points are shown. (B) Median (range) percent change from baseline in BM T cells (as a percentage of lymphocytes) of daratumumab-treated patient.
Figure 5
Figure 5
Ratio of CD8+ to CD4+ or Tregs over time. (A) Median ratios of CD8+:CD4+ (left; n = 58) and CD8+:Tregs (right; n = 38) increased at weeks 8 and 16 compared with baseline in the PB. Only patients with baseline, week 8, and week 16 measurements were included. (B) Similarly, in BM, median ratios of CD8+:CD4+ (left) and CD8+:Tregs (right) increased on treatment (week 12 ± 1 cycle) compared with baseline. No significant differences were observed between responders and nonresponders.
Figure 6
Figure 6
Effect of daratumumab treatment on T-cell clonality. Patients with pre- and posttreatment samples were evaluated (n = 17). TCR clonality (A) increased during treatment with daratumumab and (B) was correlated with increases in CD8+ T cells. The sum of absolute CIA in responders and nonresponders is shown (C) for each expanded T-cell clone and (D) maximum CIA of a single T-cell clone. NR, nonresponder; R, responder.
Figure 7
Figure 7
Multifactorial mechanism of action of daratumumab. Daratumumab induces antimyeloma effects via multiple mechanisms of action. Based on the present study, an additional mechanism of action is proposed in which treatment with daratumumab eliminates a population of highly immunosuppressive CD38+ Tregs, T-cell MDSCs, and Bregs and thus stimulates T-cell effector functions. DARA, daratumumab.

Comment in

Similar articles

Cited by

References

    1. Harousseau JL. Ten years of improvement in the management of multiple myeloma: 2000-2010. Clin Lymphoma Myeloma Leuk. 2010;10(6):424–442. - PubMed
    1. Kastritis E, Zervas K, Symeonidis A, et al. Improved survival of patients with multiple myeloma after the introduction of novel agents and the applicability of the International Staging System (ISS): an analysis of the Greek Myeloma Study Group (GMSG). Leukemia. 2009;23(6):1152–1157. - PubMed
    1. Kumar SK, Rajkumar SV, Dispenzieri A, et al. Improved survival in multiple myeloma and the impact of novel therapies. Blood. 2008;111(5):2516–2520. - PMC - PubMed
    1. Kumar SK, Lee JH, Lahuerta JJ, et al. International Myeloma Working Group. Risk of progression and survival in multiple myeloma relapsing after therapy with IMiDs and bortezomib: a multicenter international myeloma working group study. Leukemia. 2012;26(1):149–157. - PMC - PubMed
    1. Dosani T, Carlsten M, Maric I, Landgren O. The cellular immune system in myelomagenesis: NK cells and T cells in the development of myeloma [corrected] and their uses in immunotherapies. Blood Cancer J. 2015;5:e306. - PMC - PubMed

Publication types

MeSH terms