

Structural and functional brain abnormalities place phenocopy frontotemporal dementia (FTD) in the FTD spectrum
- PMID: 27222795
- PMCID: PMC4856342
- DOI: 10.1016/j.nicl.2016.03.019
Structural and functional brain abnormalities place phenocopy frontotemporal dementia (FTD) in the FTD spectrum
Abstract
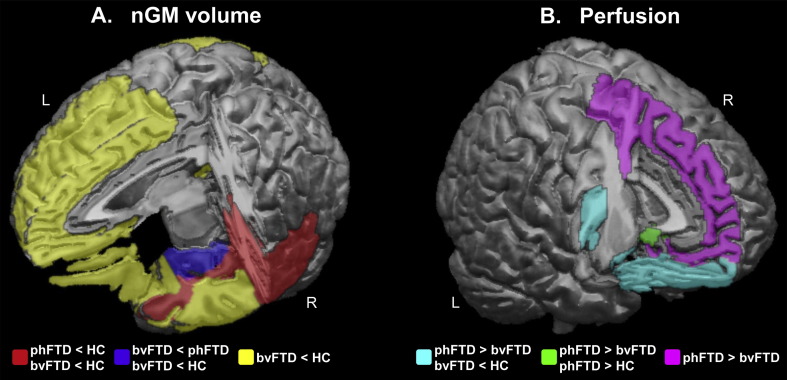
Purpose: 'Phenocopy' frontotemporal dementia (phFTD) patients may clinically mimic the behavioral variant of FTD (bvFTD), but do not show functional decline or abnormalities upon visual inspection of routine neuroimaging. We aimed to identify abnormalities in gray matter (GM) volume and perfusion in phFTD and to assess whether phFTD belongs to the FTD spectrum. We compared phFTD patients with both healthy controls and bvFTD patients.
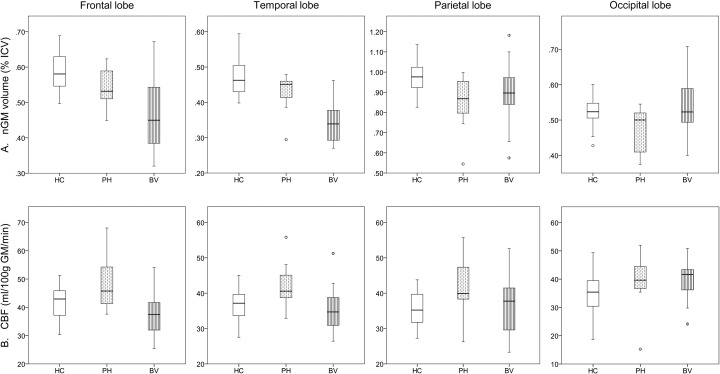
Materials & methods: Seven phFTD and 11 bvFTD patients, and 20 age-matched controls underwent structural T1-weighted magnetic resonance imaging (MRI) and 3D pseudo-continuous arterial spin labeling (pCASL) at 3T. Normalized GM (nGM) volumes and perfusion, corrected for partial volume effects, were quantified regionally as well as in the entire supratentorial cortex, and compared between groups taking into account potential confounding effects of gender and scanner.
Results: PhFTD patients showed cortical atrophy, most prominently in the right temporal lobe. Apart from this regional atrophy, GM volume was generally not different from either controls or from bvFTD. BvFTD however showed extensive frontotemporal atrophy. Perfusion was increased in the left prefrontal cortex compared to bvFTD and to a lesser extent to controls.
Conclusion: PhFTD and bvFTD show overlapping cortical structural abnormalities indicating a continuum of changes especially in the frontotemporal regions. Together with functional changes suggestive of a compensatory response to incipient pathology in the left prefrontal regions, these findings are the first to support a possible neuropathological etiology of phFTD and suggest that phFTD may be a neurodegenerative disease on the FTD spectrum.
Keywords: Arterial spin labeling-MRI; Behavioral variant frontotemporal dementia; Cerebral blood flow; Gray matter volume; Phenocopy frontotemporal dementia.
Figures
Similar articles
-
Phenocopy syndrome of behavioral variant frontotemporal dementia: a systematic review.Alzheimers Res Ther. 2019 Apr 1;11(1):30. doi: 10.1186/s13195-019-0483-2. Alzheimers Res Ther. 2019. PMID: 30935398 Free PMC article.
-
Functional connectivity and microstructural white matter changes in phenocopy frontotemporal dementia.Eur Radiol. 2017 Apr;27(4):1352-1360. doi: 10.1007/s00330-016-4490-4. Epub 2016 Jul 19. Eur Radiol. 2017. PMID: 27436017 Free PMC article.
-
Qualitative Assessment of Longitudinal Changes in Phenocopy Frontotemporal Dementia.Front Neurol. 2019 Nov 14;10:1207. doi: 10.3389/fneur.2019.01207. eCollection 2019. Front Neurol. 2019. PMID: 31798526 Free PMC article.
-
Differential Hemispheric Predilection of Microstructural White Matter and Functional Connectivity Abnormalities between Respectively Semantic and Behavioral Variant Frontotemporal Dementia.J Alzheimers Dis. 2017;56(2):789-804. doi: 10.3233/JAD-160564. J Alzheimers Dis. 2017. PMID: 28059782
-
Neuroimaging in frontotemporal dementia.Int Rev Psychiatry. 2013 Apr;25(2):221-9. doi: 10.3109/09540261.2013.778822. Int Rev Psychiatry. 2013. PMID: 23611351 Review.
Cited by
-
Arterial spin labelling magnetic resonance imaging and perfusion patterns in neurocognitive and other mental disorders: a systematic review.Neuroradiology. 2024 Jul;66(7):1065-1081. doi: 10.1007/s00234-024-03323-0. Epub 2024 Mar 27. Neuroradiology. 2024. PMID: 38536448 Free PMC article.
-
Diagnostic Utility of Measuring Cerebral Atrophy in the Behavioral Variant of Frontotemporal Dementia and Association With Clinical Deterioration.JAMA Netw Open. 2021 Mar 1;4(3):e211290. doi: 10.1001/jamanetworkopen.2021.1290. JAMA Netw Open. 2021. PMID: 33704477 Free PMC article.
-
A narrative review on mild behavioural impairment: an exploration into its scientific perspectives.Aging Clin Exp Res. 2023 Sep;35(9):1807-1821. doi: 10.1007/s40520-023-02472-1. Epub 2023 Jul 1. Aging Clin Exp Res. 2023. PMID: 37392350 Review.
-
Phenocopy syndrome of behavioral variant frontotemporal dementia: a systematic review.Alzheimers Res Ther. 2019 Apr 1;11(1):30. doi: 10.1186/s13195-019-0483-2. Alzheimers Res Ther. 2019. PMID: 30935398 Free PMC article.
-
Detecting frontotemporal dementia syndromes using MRI biomarkers.Neuroimage Clin. 2019;22:101711. doi: 10.1016/j.nicl.2019.101711. Epub 2019 Feb 4. Neuroimage Clin. 2019. PMID: 30743135 Free PMC article.
References
-
- Alsop D.C., Detre J.A., Golay X., Günther M., Hendrikse J., Hernandez-Garcia L., Lu H., MacIntosh B.J., Parkes L.M., Smits M. Recommended implementation of arterial spin-labeled perfusion MRI for clinical applications: a consensus of the ISMRM perfusion study group and the european consortium for ASL in dementia. Magn. Reson. Med. 2015;73(1):102–116. - PMC - PubMed
-
- Andreasen N.C., O'Leary D.S., Flaum M., Nopoulos P., Watkins G.L., Boles Ponto L.L., Hichwa R.D. Hypofrontality in schizophrenia: distributed dysfunctional circuits in neuroleptic-naive patients. Lancet. 1997;349(9067):1730–1734. - PubMed
-
- Asllani I., Borogovac A., Brown T.R. Regression algorithm correcting for partial volume effects in arterial spin labeling MRI. Magn. Reson. Med.: Official Journal of the Society of Magnetic Resonance in Medicine/Society of Magnetic Resonance in Medicine. 2008;60(6):1362–1371. - PubMed
-
- Barnes J., Whitwell J.L., Frost C., Josephs K.A., Rossor M., Fox N.C. Measurements of the amygdala and hippocampus in pathologically confirmed Alzheimer disease and frontotemporal lobar degeneration. Arch. Neurol. 2006;63(10):1434–1439. - PubMed
Publication types
MeSH terms
Substances
LinkOut - more resources
Full Text Sources
Other Literature Sources
